Variability in Atlantic hurricanesNatural Risks
Richard J. Murnane
Risk Prediction Initiative. Bermuda Institute of Ocean Sciences
St. George - Bermuda
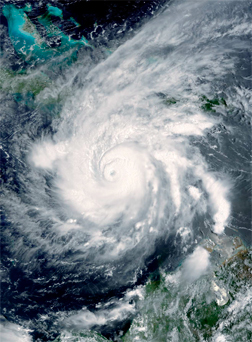


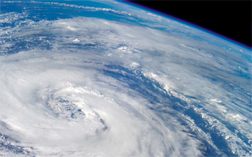
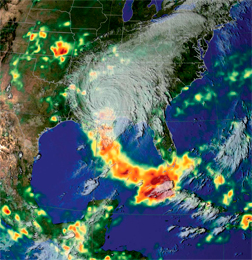
Reinsurers often prefer hurricane catastrophe risk models based on the assumption that current basin-wide tropical cyclone activity and landfall rates are greater than the long-term average. In contrast to the view that we are in an era of relatively elevated hurricane activity, most forecasts of 2012 Atlantic basin hurricane activity predict a near-normal season with hurricane numbers and landfalls close to the long-term average. For many people this contrast and the importance of defining the “correct” landfall rate might prompt a number of questions such as: how do we define “normal activity”, what time scale(s) are used to define normal, what controls normal or anomalous activity, and will the definition of normal change? To answer these questions one must understand the historical record’s idiosyncrasies and how climate influences hurricanes. The answers are important for science, our society and the economy; they also are of great relevance to users of catastrophe risk models. For example, ceteris paribus, modeled losses based on elevated landfall rates are greater than those based on long-term climatology.
Here I hope to provide succinct answers to these questions. I focus on the Atlantic basin and US landfalls for two reasons: 1) of all regions subject to tropical cyclones, the Atlantic offers a combination of the highest quality data and longest “complete” record, and 2) the size of US insurance market and its importance to the reinsurance industry. I consider the Atlantic basin in the broadest sense and thus include the Gulf of Mexico and the Caribbean in the Atlantic numbers.
The hurricane data
How do we define “normal activity”, what time scale is used to define normal, what controls normal or anomalous activity, and will the definition of normal change?
Explanations regarding the uncertainties in how hurricane activity might change are more understandable if one is familiar with the quality of hurricane data. The best-track data for tropical cyclones form the foundation of the hurricane catalogs used by catastrophe risk models. Among the parameters recorded in the best-track data are a tropical cyclone’s latitude and longitude, central pressure, and maximum 1-minute sustained wind speed at 10 meters rounded to the nearest 5 knots. All data are provided at 6-hour intervals.
The 6-hourly record of best-track hurricane data for the North Atlantic, known as HURDAT, starts in 1851. The original HURDAT compilation [Hope and Neumann, 1968] was developed in the 1960s for NASA to estimate hurricane wind risk near Cape Canaveral. Current uses of the HURDAT data are far beyond what was originally envisioned, and as a result, there is an ongoing effort to reanalyze and improve the data [Landsea et al., 2004].
How much might the missing storms contribute to the upwards trend?
Not surprisingly, the quality of the data and completeness of the observations used to develop HURDAT decrease as one goes back in time. A number of factors contribute to this decay in quality. For example, prior to 1931 wind speeds were recorded once daily at 12:00 GMT, and between 1931 and 1956 data were recorded twice daily at 00:00 and 12:00 GMT. Before the satellite era began in the mid-1960s there was no complete global view of storm activity so it is easy to imagine that storms could remain unobserved if they remained far from land. Routine aircraft observations of tropical cyclones in the Atlantic began in 1944. Prior to 1944, many storms would be detected or recorded only if they crossed land or encountered a ship. A brief history of the best-track data can be found in [Murnane, 2004].
Basin-wide hurricane counts
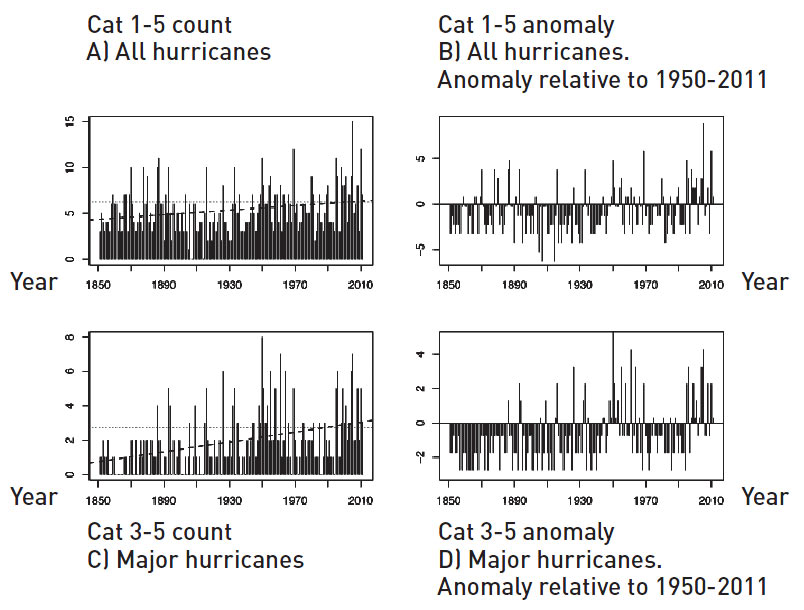
With this understanding of how data quality has evolved through time we can better assess the history of tropical cyclone activity in the Atlantic. As shown in Figure 1, the count of hurricanes and major hurricanes in the earlier part of the record appears lower than the average of the 1950-2011 period. In addition, there appears to be a positive trend in hurricane and major hurricane counts. Considering the changes in observational technology noted above, it seems reasonable to expect that some storms are missing from the early record and that the positive trends in counts are likely due, at least in part, to the missing storms. But, how much might the missing storms contribute to the trend?
Numerous papers assess the trend in hurricane count to determine whether the trend is real, an artifact of the data, or some combination of both. A simple summary of these papers suggests two main factors that should be considered when analyzing trends and variability in the historical record. The first is that in the earliest records up to four or more storms could be missing each year purely due to fewer ships and therefore less frequent storm encounters in the early record [Vecchi and Knutson, 2008]. The second is that observational technologies, mainly associated with satellites, allow us to more efficiently identify short-lived storms with lifespans of one to two days [Landsea et al., 2010]. Almost all of these short-lived storms tend to be tropical storms and very unlikely to be major hurricanes. After making corrections for these factors, which are also subject to uncertainty, the long-term trends seen in Figure 1 become significantly smaller. However, there remains the possibility that a portion of the increase in short-lived storms and/or in the long-term trend is real. The upward trends in hurricane and major hurricane counts are no doubt smaller than that shown in Figure 1. Unfortunately, data uncertainty makes it impossible to define precisely the long-term trend in basin-wide Atlantic hurricane activity. However, as shown below, there is more certainty regarding variability on decadal and interannual time scales.
Climate and hurricane activity
Among the many factors affecting hurricane activity in the Atlantic, perhaps the most important two are the Atlantic Multi-decadal Oscillation (AMO) and the El Niño-Southern Oscillation (ENSO). The AMO characterizes a decadal scale variation in North Atlantic sea surface temperature (SST). The ENSO represents a coupled ocean-atmosphere oscillation whose period ranges from ~3 to ~7 years. The oceanic component (El Niño) is characterized by equatorial Pacific SSTs; the atmospheric component (the Southern Oscillation) involves differences in atmospheric pressure at sea level between Tahiti and Darwin, Australia. The methods used to calculate the AMO and the Southern Oscillation Index (SOI) can vary1 but in general any differences in methodology do not have a strong impact on the following discussion.
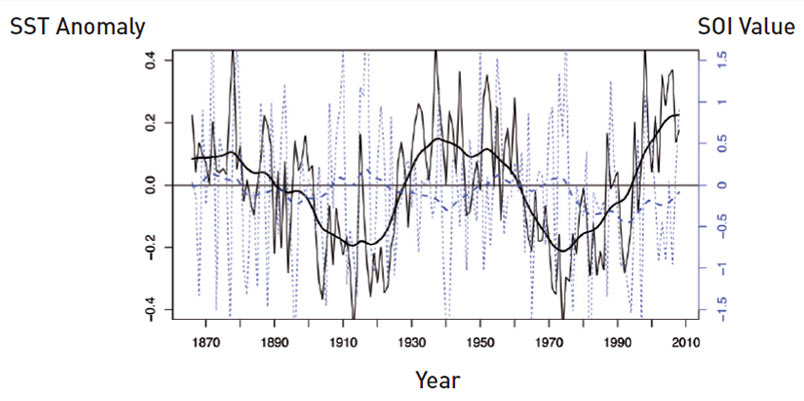
The SOI is derived from atmospheric pressure so it is not surprising that it varies on a shorter time scale than the AMO that is based on SST (Figure 2). A 10-year filter can be used to highlight longer-term variability in the SST anomalies and the SOI. The SOI component of ENSO represents the atmospheric portion of a coupled pattern of equatorial Pacific Ocean and atmosphere variability. Positive SOI values are associated with La Niña, negative SOI with El Niño. ENSO has a global influence and thus changes in the Pacific can influence Atlantic hurricane activity. Wind shear in the tropical Atlantic tends to be higher with El Niño than with La Niña. As tropical cyclone genesis and intensification are favoured in environments with low wind shear, one would expect enhanced hurricane activity during La Niña periods and diminished activity during El Niño periods (Figure 3).
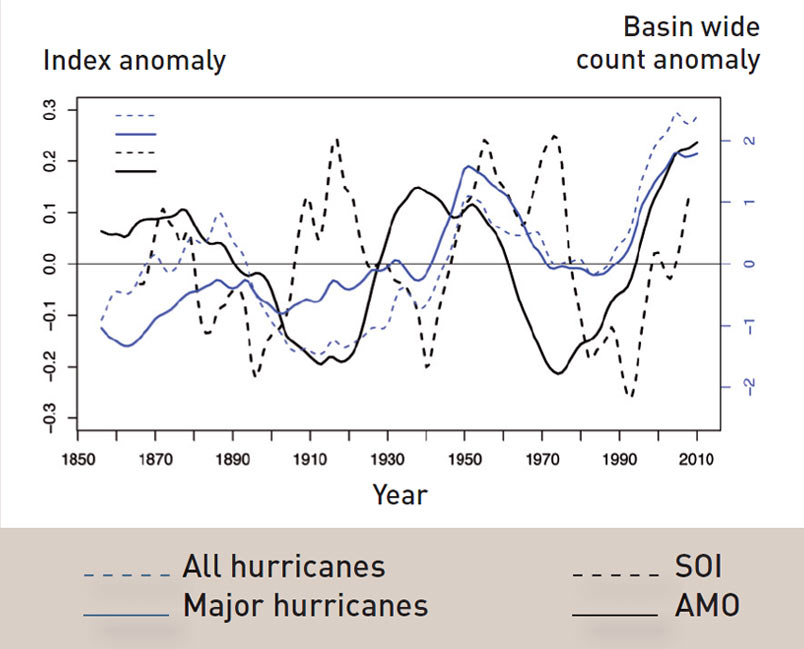
The relationship between the AMO and Atlantic hurricane activity can be understood using the theory of maximum potential intensity for a tropical cyclone. A key theoretical point is that the larger the temperature gradient between the sea surface and the top of the troposphere, the more energy is available to a tropical cyclone (assuming SSTs are sufficiently warm, ~26°C). While SST is a convenient marker, the heat content of the ocean below the tropical cyclone better quantifies the energy available to a tropical cyclone. Warmer waters with deeper thermoclines have greater heat content than cooler waters and shallow thermoclines, and therefore can provide more energy to a tropical cyclone. Thus, one would expect that higher SSTs and a positive AMO should be correlated with more hurricane activity. The relationship between the AMO as characterized by North Atlantic SSTs, and hurricane activity characterized by anomalies from the long-term average, is not perfect, but it tends to be consistent with expectations that during positive AMO phases hurricanes tend to be more intense and there are more major hurricanes (Figure 3). There is debate in the scientific community regarding whether the AMO, like ENSO, is a pattern of natural variability or whether it is instead a result of anthropogenic aerosol emissions and largescale warming.
Hurricane landfall
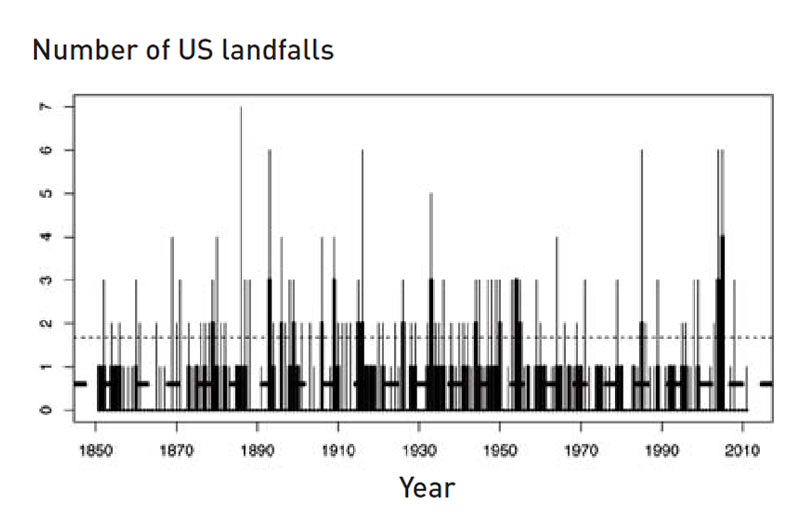
While basin-wide statistics are scientifically useful because that is where most tropical cyclones occur, (re)insurers are more interested in landfall rates, and in particular, the rate for major hurricane landfall. The data challenges related to missing and sparse observations discussed above are not as severe when it comes to counts of hurricane landfall. In fact, data for the count of US landfalls after 1900 are thought to be fairly robust. However, the ongoing HURDAT reanalysis effort has changed the landfall numbers for some years and altered the intensity at landfall of a significant fraction of events. With these caveats in mind, one can consider the annual count of hurricane and major hurricane landfalls (Figure 4) to be fairly robust. It is apparent that while there is variability, there is no long-term trend in hurricane landfalls.
The ongoing HURDAT reanalysis effort has changed the landfall numbers for some years and altered the intensity at landfall of a significant fraction of events
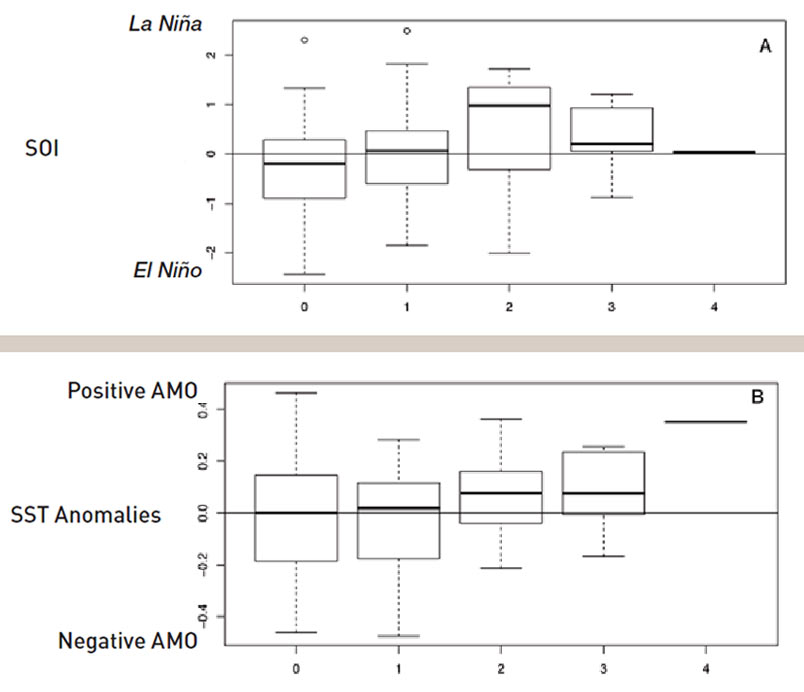
Relatively warm SSTs and positive SOI values are both correlated with more basinwide tropical cyclones. A reasonable guess would be that a similar correlation would exist for numbers of US landfalls. To a first order this turns out to be correct (Figure 5), but the correlation of SOI and the AMO with major hurricane landfall provides little information regarding seasonal activity for a specific year. Hodges and Elsner [2010] show that the relationship between SOI and major hurricane landfalls is stronger than that for the AMO. In addition they highlight the importance of two other factors that are beyond the scope of this paper but should be mentioned: the North Atlantic Oscillation (NAO) and sunspots. Negative values of the NAO and elevated sunspot numbers are associated with more US hurricane landfalls.
What is “normal”?
From this discussion of data quality and of the factors that influence hurricane activity, it should be clear that it is not easy to define “normal” conditions. Normal conditions could most easily be described as an average over a period of time long enough to sample variability on time scales of interest. Typically, more is better when it comes to data, but this must be balanced by data quality considerations. For US hurricane landfall, the period used to define normal should be sufficiently long to adequately sample multi-decadal variability. Unfortunately, the landfall data are too limited to determine if there is significant centennial-scale variability. However, studies of hurricane variability using geological proxies such as overwash deposits in coastal lakes and isotopic signatures in cave deposits suggest that there is significant millennial-scale variability. Fortunately, millennial time scales are of little relevance to (re)insurers so this additional complexity can be omitted from hurricane cat models. Given all that is known about US landfalls it is somewhat ironic that even if it was possible to know the exact state of the AMO, ENSO, NAO, and sunspots for the upcoming season, seasonal forecasts of the number of US landfalls would remain imprecise given the randomness of the ocean and atmosphere.
It is somewhat ironic that even if it was possible to know the exact state of the AMO, ENSO, NAO, and sunspots for the upcoming season, seasonal forecasts of the number of US landfalls would remain imprecise given the randomness of the ocean and atmosphere
How does this discussion relate to the medium-term view used in hurricane cat models? As shown in Figure 2, we are in an era of positive SST anomalies and thus reasonably expect that hurricane landfall rates should be higher than the long-term average. But, Atlantic SSTs are not the only important factor. The influence of ENSO/SOI, the NAO, and sunspots should also be considered. For example, years with a strong El Niño would be expected to have lower hurricane landfall rates than years with La Niña. Given the range of possibilities, users of cat models would be well served by managing their business in a manner that is resilient to a variety of different landfall scenarios.
Concluding remarks
Currently, most studies of how tropical cyclones will respond to anthropogenic warming suggest a small increase in intensity and precipitation and a small decrease in frequency
In the future, anthropogenic climate change will likely alter many aspects of the ocean and atmosphere. For example, it is likely that Atlantic SSTs will increase, but the response of ENSO is more uncertain. Currently, most studies of how tropical cyclones will respond to anthropogenic warming suggest a small increase in intensity and precipitation and a small decrease in frequency. In fact, there are indications that the strongest storms are getting stronger [Elsner et al., 2008].
Although this paper is focused on hurricane activity in the Atlantic, a few general comments regarding current and future tropical cyclone activity in other regions seem warranted. First, data limitations in other regions are worse than those in the Atlantic. Luckily, the growing arsenal of satellitederived data ameliorates the paucity of in-situ aircraft measurements outside of the Atlantic. Nonetheless, in-situ measurements of tropical cyclones in other basins would be welcome. Second, the influence of SST, ENSO, and NAO are also important in other basins although the impact may be opposite in sign to what applies in the Atlantic. Finally, most model studies of future climate suggest with some confidence an increase in tropical cyclone intensity and precipitation.
However, regardless of future changes in tropical cyclone activity, the threat from storm surge will increase as sea level rises due to thermal expansion of the ocean and melting of continental ice
Estimates of how other factors such as tropical cyclone frequency and tracks might change are highly uncertain. Confidently predicting how tropical cyclones will change in the future is challenging for a number of reasons including: 1) the limited resolution of climate models make it difficult to generate realistic tropical cyclones (though this is becoming less of a problem), 2) model simplifications often do not realistically simulate the atmosphere and ocean on scales relevant to tropical cyclone behaviour, and 3) it is impossible to know future greenhouse gas emissions. Storm surge is an additional hazard that is generally not considered in studies of future changes in tropical cyclone activity. However, regardless of future changes in tropical cyclone activity, the threat from storm surge will increase as sea level rises due to thermal expansion of the ocean and melting of continental ice.
1 I use SST data from the NOAA ERSST V2 SST, interpolated to a 5x5 grid, available at: http://www.esrl.noaa.gov/psd/data/correlation/amon.us.long.mean.data. For the Southern Oscillation Index (SOI) I use data from the Climatic Research Unit at the University of East Anglia, available at: http://www.cru.uea.ac.uk/cru/data/soi/
References
Murnane, R. J. (2004), The importance of best-track data for understanding the past, present, and future of hurricanes and typhoons, in Hurricanes and Typhoons: Past, Present, and Future, edited by Murnane, R. J., and K.-b. Liu, pp. 249-266, Columbia University Press, New York.
Hope, J. R., and C. J. Neumann (1968), Probability of tropical cyclone induced winds at Cape Kennedy, Weather Bureau Technical Memorandum SOS-1, NOAA, Silver Spring, MD.
Landsea, C. W., C. Anderson, N. Charles, G. Clark, J. Dunion, J. Partagas, P. Hungerford, C. Neumann, and M. Zimmer (2004), The Atlantic hurricane database re-analysis project: Documentation for 1851- 1910 alterations and additions to the HURDAT database, in Hurricanes and Typhoons: Past, Present, and Future, edited by Murnane, R. J., and K.-B. Liu, pp. 177-221, Columbia University Press, New York.
Vecchi, G. A., and T. R. Knutson (2008), On estimates of historical North Atlantic tropical cyclone activity, J. Climate, 21, 3580-3600, doi:10.1175/2008JCLI2178.1.
Landsea, C. W., G. A. Vecchi, L. Bengtsson, and T. R. Knutson (2010), Impact of duration thresholds on Atlantic tropical cyclone counts, J. Climate, 23, 2508-2519, doi:10.1175/2009JCLI3034.1.
Hodges, R. E., and J. B. Elsner (2010), Evidence linking solar variability with US hurricanes, International J. Climatol., doi:10.1002/joc.2196.Elsner, J. B., J. P. Kossin, and T. H. Jagger (2008), The increasing intensity of the strongest tropical cyclones, Nature, 455(4), 92-95.


