The Canterbury Earthquake Sequence of 2010-2011, New Zealand: a review of seismology, damage observations and consequencesNatural Risks
Dr. Kelvin Berryman
PhD, Manager, Natural Hazards Research National Platform, GNS1
Science
GNS Science
Dr. Mathew Gerstenberger, PhD, seismologist, senior scientist
Dr. Terry Webb, PhD, Director, Natural Hazards Division
Dra. Pilar Villamor, PhD, geologist, senior scientist
Dr. Chris Massey, PhD, engineering geologist
Dra. Lindy Fursman, PhD, senior analyst, New Zealand Treasury
«The lessons learned in Christchurch, in geotechnical, structural engineering and risk, are also being noted across the country»

Abstract
The Mw 7.1 Darfield earthquake rocked the Canterbury region of central South Island at 4.36 am on 4th September, 2010. No deaths and only two serious injuries resulted. It was the first large earthquake to impact upon a major New Zealand urban area since the 1931 Hawke’s Bay event, which was the catalyst to the introduction of earthquake resistant construction in New Zealand. Over the intervening years, progressive upgrades of the seismic code have been implemented, but not tested under design levels of ground motion.
Following the Darfield earthquake hospitals continued to function, electricity was restored quickly, no buildings collapsed, and emergency response actions were prompt and effective. However the damage cost was at least USD 3 billion, much of it related to liquefaction and ground deformation which resulted in near-collapse of several modern residences, and extensive damage to water and wastewater pipe networks. Unreinforced masonry buildings were also extensively damaged. The lack of deaths in this event can be attributed to the early morning timing of the earthquake, and good luck.
Almost six months later the devastating Mw 6.2 aftershock occurred close to Christchurch city, at the fringe of the expanding aftershock zone associated with the September main shock. The earthquake occurred at 12.51 pm when approximately 50,000 people were in the inner city area, well-known for its heritage buildings and abundance of unreinforced masonry buildings. There were many structural failures under the extreme ground motions that exceeded 100% of gravity in the inner parts of the city and hillside suburbs to the south of the city. The final death toll was 181 persons. Many perished in the collapse of two multi-storey buildings. In the residential suburbs strong earthquake shaking, but more importantly widespread destructive liquefaction caused severe damage. Buildings complying with modern earthquake resistant measures generally withstood ground motion at or above their design requirements. Estimates of the cost of this event are about USD 30 billion, and represent approximately 8% of New Zealand’s annual GDP.
The earthquake sequence
September 2010 Darfield main shock
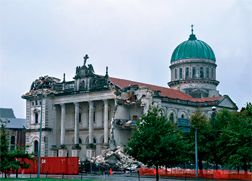
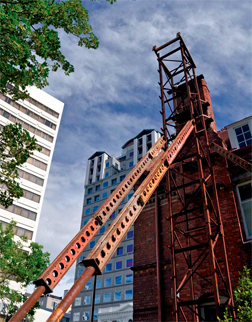
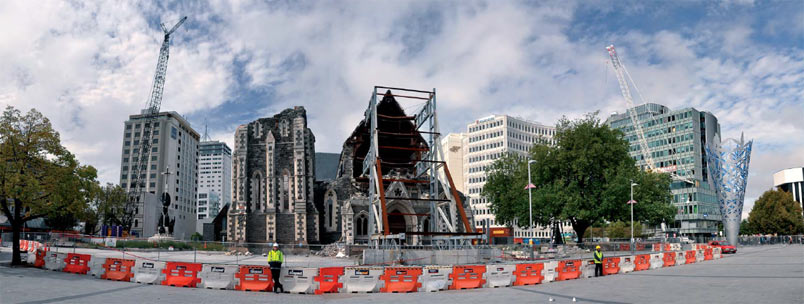
The Mw 7.1 Darfield earthquake occurred on 4th September 2010 at 04:35 NZST (3 September at 16:35 UTC) approximately 40 km west of Christchurch (a city of 375,000 population, the second-largest in New Zealand), on a previously unknown fault within the Canterbury Plains (Figure 1). This rare event, estimated to have a return period of more than several thousand years (Stirling et al., 2002) occurred Catholic cathedral at Madras Street after the 2011 Christchurch earthquake in a relatively low seismicity region of eastern South Island, New Zealand. There were no fatalities and just a few injuries. The shaking caused damage in Christchurch to older brick and masonry buildings, and to historical stone and timber buildings. The earthquake also caused liquefaction and lateral spreading along the lower reaches of rivers through Christchurch’s eastern (near coastal) suburbs and the town of Kaiapoi, about 20 km north of the city. Water and sewer pipes were broken and many streets were flooded.
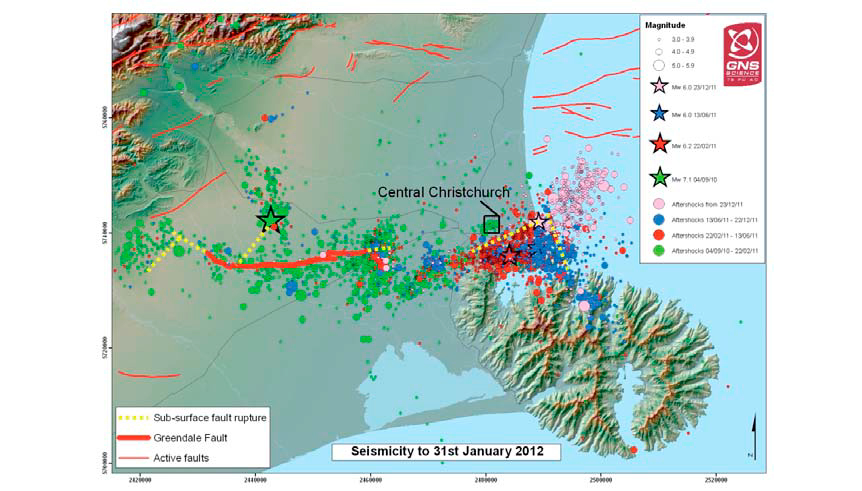
Since the Darfield earthquake, more than 7,000 aftershocks with magnitude (Mw) up to 6.2 have been recorded by the New Zealand national seismograph network (GeoNet; http://www.geonet.org.nz/). This sequence of earthquakes is termed the Canterbury earthquake sequence. In the months following the Darfield earthquake, aftershock activity was particularly concentrated at the eastern end of the Greendale Fault and extended eastward towards the city.
The February 2011 Christchurch earthquake
New Zealand straddles the boundary zone between the Australian and Pacific Plates, which are moving relative to each other at 35–45 mm/yr
The most destructive earthquake of the Canterbury sequence occurred at 12.51 NZST on 22 February 2011, five and a half months after the Darfield main shock. This Mw 6.2 aftershock (termed the Christchurch earthquake) occurred toward the eastern end of the aftershock zone and with an epicentre just 6 km southeast of the Christchurch city centre (red star in Figure 1). Particularly high accelerations were recorded in the Christchurch earthquake, a factor which led to the severe building damage, widespread liquefaction and landslides. The February 22 earthquake led to an increase in aftershock activity, with several strong aftershocks of Mw>5.
The Christchurch earthquake was the most deadly in New Zealand since the 1931 Hawke’s Bay (Napier) earthquake, with 181 people killed and several thousand injured. About two-thirds of the fatalities were from the collapse of two multi-storey office buildings, one that was designed and built in the 1960’s, the other in the 1980’s. Many were killed in the streets by falling bricks and masonry, and in two buses crushed by collapsing buildings. Five people died in the hillside suburbs south of the city, killed by collapsing rock cliffs and falling boulders. The earthquake brought down many buildings previously damaged in the September 2010 earthquake. Many heritage buildings were heavily damaged. A number of modern buildings were also damaged beyond repair, including Christchurch’s tallest building. Liquefaction was even more widespread than in the Darfield earthquake, occurring in a number of suburbs that had not been affected in September.
The June 2011 Christchurch earthquake
On 13 June 2011 at 14:20 NZST, an Mw 6.0 earthquake occurred near the suburb of Sumner (blue star in Figure 1). This earthquake resulted in one fatality and caused yet more damage in Christchurch, causing irreparable damage to many CBD (Christchurch Building District) buildings scheduled for repair. The earthquake once again produced high accelerations in the southern and eastern suburbs, causing more widespread liquefaction, and rockfalls from cliffs in hillside suburbs.
The December 2011 Christchurch earthquake
On 23 December, two days before Christmas Day, a Mw 5.8 earthquake struck east of Christchurch just off the coast at 1:58 pm. As with other earthquakes of this shaking intensity, liquefaction occurred in the eastern suburbs of Christchurch. This new sequence of earthquakes was further east again from the June 13 set of quakes. Being further from people, and coupled with the slightly lower magnitudes of the biggest shakes, the effects were less damaging to structures than on previous occasions. Because of the time of the year (just before Christmas holiday), the longevity of the whole Christchurch series (15 months since the beginning of the events), and the numerous aftershock throughout that afternoon and overnight, several over magnitude 5, the December 2011 caused extreme anxiety and feelings of hopelessness in the population.
Earthquake forecasts
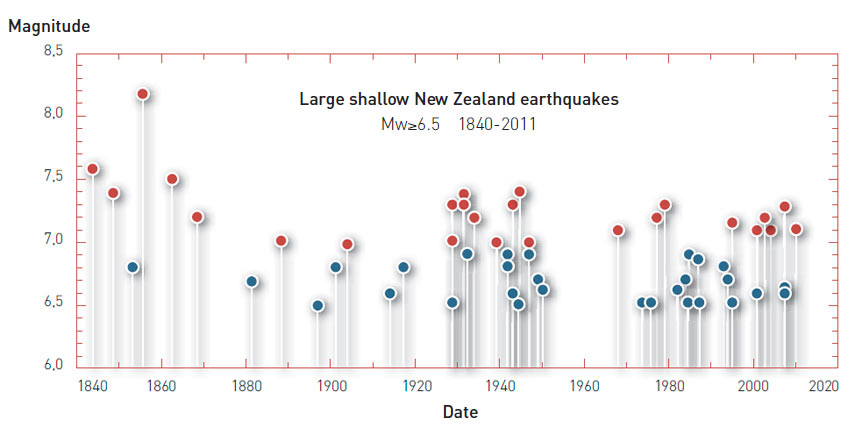
The level of seismic hazard in Canterbury is currently higher than the long-term average, and is likely to stay this way for several decades, as a combination of a rich aftershock sequence, and the possibility that an earthquake of a size comparable to the Darfield earthquake might be triggered within the region. This tendency for large earthquakes to be unevenly distributed in time, i.e., to group in time (these groups of earthquakes are denominated ‘clusters’) has been seen in New Zealand’s historical large earthquakes. Figure 2 shows the time distribution of earthquakes of magnitude 6.5 and larger during historic times (from 1840) in New Zealand. Clusters of large earthquake occurred in the mid 1980’s, 1930’s and 1940’s. The onset of a new cluster is probably occurring since 1994.
New Zealand seismic resistant design is provided by the New Zealand Loadings Standard (NZS 1170). That standard uses the normal background seismicity pre-2010 (Stirling et al., 2002). In order to provide the appropriate seismic design considered when reassessing the safety of existing structures and for the design of new buildings and infrastructure in and around Christchurch, the new increased levels of seismicity need to be incorporated into the code. For this purpose, a new seismic hazard model that includes time varying seismicity has been developed and new seismic design coefficients produced (Gerstenberger et al., 2011; Webb et al., 2011).
Tectonic setting
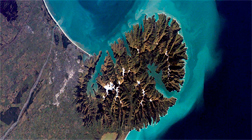
New Zealand straddles the boundary zone between the Australian and Pacific Plates, which are moving relative to each other at 35– 45 mm/yr (Figure 3).
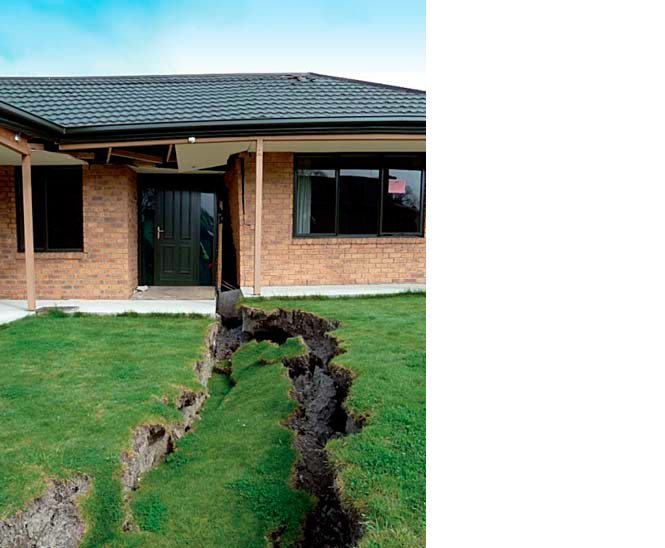
Liquefaction occurred in a larger area than that predicted by pre-earthquake susceptibility maps (more than 50% of the city), although the general indicators of susceptible areas were well known
In the North Island, the plates are converging, and the relatively thin ocean crust of the Pacific Plate subducts westward beneath the eastern North Island along the Hikurangi Trough. Subduction also occurs offshore and south of the South Island, except here the thin ocean crust of the Australian Plate subducts eastward beneath Fiordland along the offshore Puysegur Trench. In the central and northern South Island, however, both the Pacific and Australian plates have thick crust and subduction cannot occur. Tectonic deformation is achieved by strike slip along the boundary, with the west coast moving north-eastward relative to the rest of the South Island at a rate of ~30 mm/ yr, largely on the Alpine fault (Berryman et al., 1992; Norris and Cooper, 2001). In addition to this, the Pacific and Australian plates collide head-on at ~5–10 mm/yr (Beavan et al., 2002), leading to the growth of the Southern Alps over the last few million years.
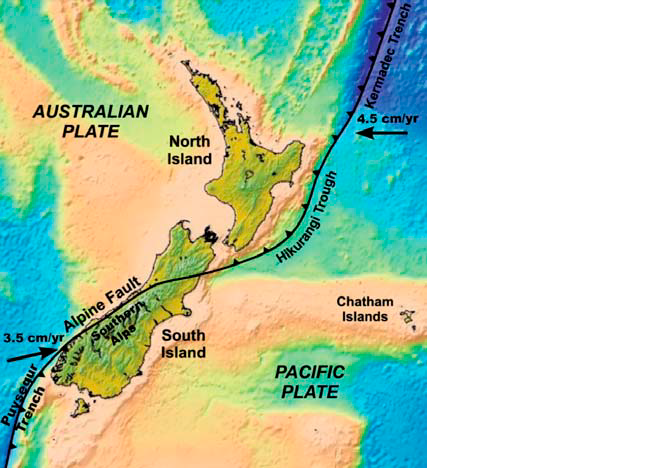
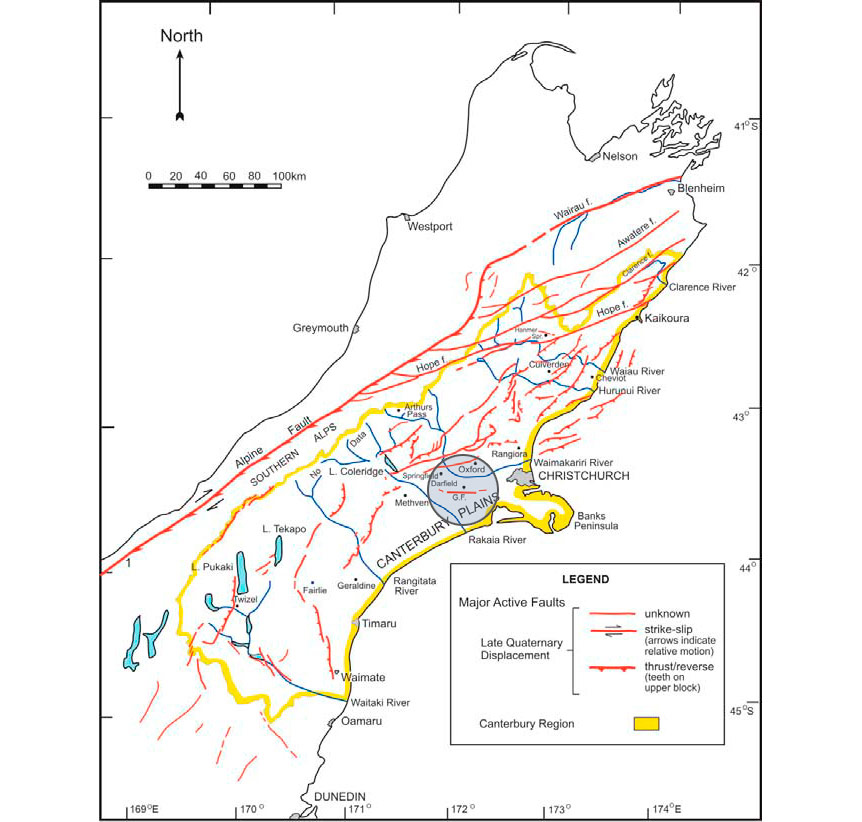
The land to the east of the Alpine Fault is also broken up into a complex web of active geological faults - here the remaining 25% of the plate motion occurs through occasional earthquakes on these faults (Cox and Sutherland, 2007; Pettinga et al., 2001, Wallace et al., 2007) (Figure 4).
GPS measurements suggest that fault lines beneath the Canterbury Plains region are accommodating ~5% of the overall Pacific/ Australia plate motion, ~1-2 mm/yr on average (Wallace et al., 2007). Since September 2010, patterns of aftershocks, and subsurface geophysical studies, have revealed the existence of several previously unrecognized faults (Figure 1).
Strong ground motion and comparison New Zealand building code provisions
The New Zealand design standard NZS1170 sets guidelines for the levels of ground motion that are expected to occur at average intervals of 500 years, 1,000 years and 2,500 years for ‘normal use’, ‘major use’ and ‘post-disaster use’ structures, respectively. During the 2010-12 earthquake sequence, Christchurch city experienced different levels of strong ground motions and, in some occasions, they exceeded design levels as described next.
September 2010 Darfield main shock
Socio-economic impacts have occurred because of the lack of functionality of commercial buildings even though the structure has performed well
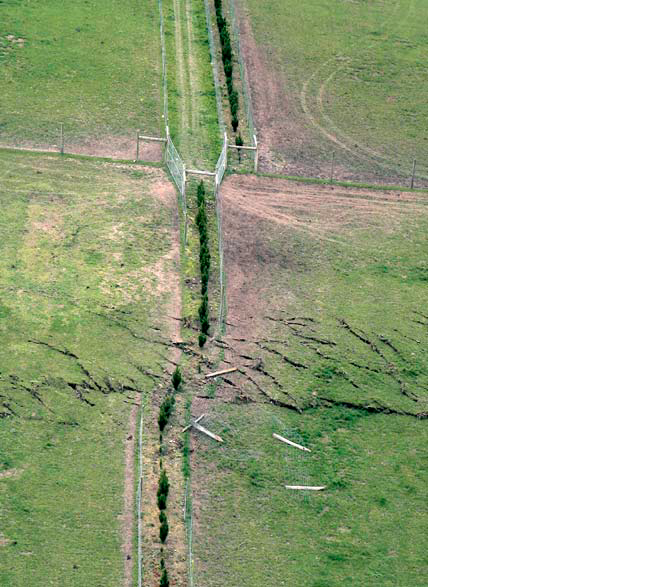
The Mw 7.1 Darfield earthquake occurred on a fault that was previously unknown, the Greendale fault (Figure 1 and 5). The fault had not been mapped prior to 2010 and displacements along the fault during the 4th September Earthquake revealed a line rupturing the ground surface. The surface rupture extends for ~29.5 km, mainly across low-relief pastoral farmland (Figure 5). Displacement was predominantly horizontal (strike-slip) displacing farm fences, roads, power lines and railway trucks in a rightlateral sense. The average displacement was ~2.5 m (maximum of ~5 m) horizontal and ~1.5 m vertical (Quigley et al. 2010; 2011). Information from seismographs, GPS and processed satellite radar (InSAR) data showed the fault mapped was not the only fault rupture associated with the Mw 7.1 Darfield earthquake. The earthquake rupture was in fact a complex process involving rupture of several fault segments, including blind reverse (contractional), and strike-slip (Figure 1; Beavan et al., 2010, Holden et al. 2011).
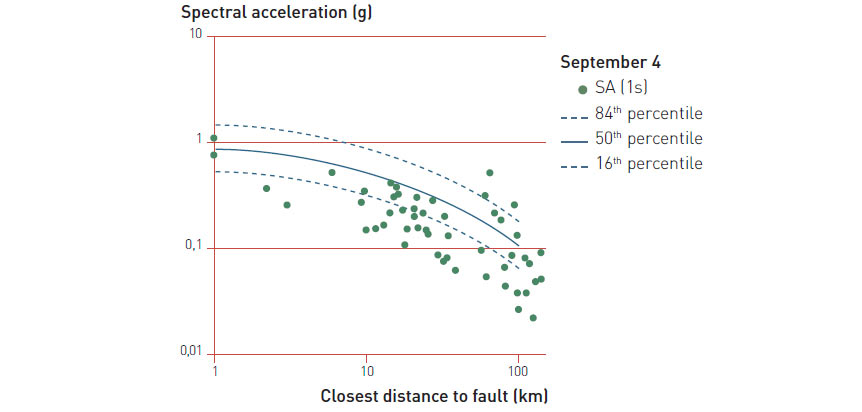
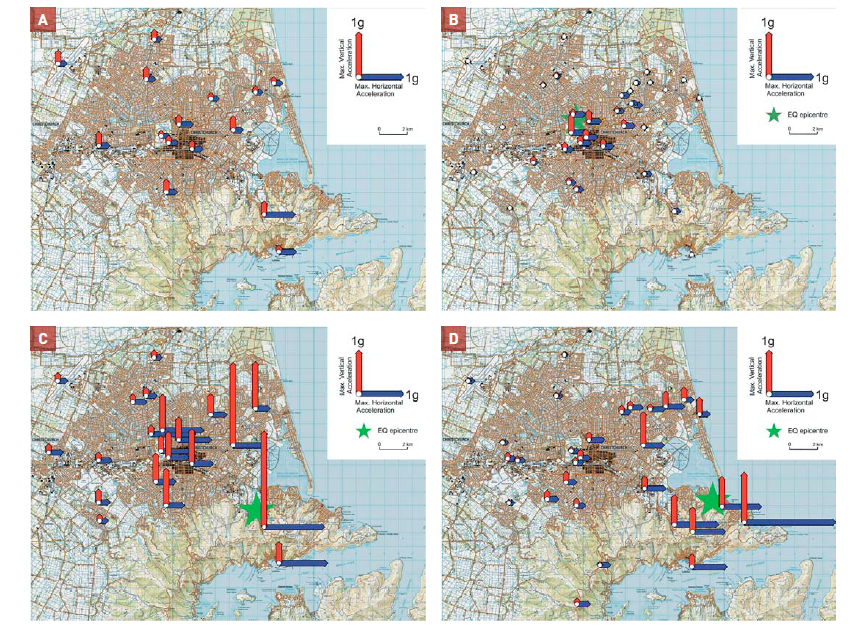
The earthquake ground motions in the wider region during the Mw 7.1 Darfield event were very high. The ground accelerations reached 1.26 times the value of the Earth’s acceleration (1g=9.8 m/seg2) close to the fault, and up to 0.3g in central Christchurch, over 35 km from the epicentre. Horizontal ground accelerations were generally comparable to those predicted by the New Zealand models of seismic wave attenuation with distance (McVerry 2006; Figure 6), the principal model underpinning the National Building Code. The values observed were similar to the ones predicted by that model for waves with periods of 1.0 second which are important for building design codes, and for deep or very soft soils (attenuation is different for rock or soft soils). These accelerations were generally close to the ones design level in central Christchurch (0.3g), but exceeded the design level in the epicentral region. Maximum horizontal and vertical ground accelerations in the Christchurch city area were recorded in numerous seismographs and are shown on Figure 7. While accelerations are mainly small (all are <1g and most are < 0.3g), unusually high motions for short period waves were observed in a suburb to the south of the city (Figure 7A). Those higher accelerations could be due to amplification by local soft shallow soils and basin structure (the depth and changes in depth of the sedimentary basin can affect wave amplification).
The energy released (or stress drop) in the Darfield event was very high for a Mw 7.1 event (G. Choy, personal communication; Fry & Gerstenberger 2011). Similar high stress drop characteristics have been observed in all the larger events of the Canterbury sequence, and appears to correlate with regions of low seismicity were strain accumulates slowly and fault rupture has long recurrence intervals.
The February 2011 Christchurch earthquake
The Mw 6.2 February 22 Christchurch earthquake was by far the most destructive of the Canterbury sequence, with severe ground shaking occurring over much of the city (Figure 7C). The earthquake occurred on a northeast-southwest oriented fault and the epicentre was very shallow (7 km deep). Slip along the fault reached within ~1 km of the surface but did not break the surface. This fault was unknown prior to the earthquake, but aftershocks had occurred in the epicentral area in the months prior to the Christchurch earthquake. The rupture had oblique motion (a combination of rightlateral strike-slip and reverse). Because the fault did not rupture the ground, the amount of displacement could not be measured in the field, but based on geodetic and seismological data, the rupture produced maximum slip of 2.5–4.0 m at a depth of 4–5 km (Beavan et al. 2011; Holden 2011).
Ground motions in Christchurch city were extremely high during the February event, reaching 2.2 times the Earth’s gravity (g) near the epicentre and up to 0.8 g in the CBD (Figure 7C). In areas close to the fault (less than 5 km away) horizontal accelerations were stronger in the Christchurch event than the Darfield main shock (Kaiser et al. 2011; Cousins & McVerry 2010).
The accelerations recorded during the 22nd February event were larger than those used in the New Zealand design standard for ‘normal use’ structures (average interval of 500 years), that is for building design (Webb et al., 2011). A number of factors are thought to have contributed to the high accelerations experienced in Christchurch city during the 22 February event (Fry et al. 2011a; Reyners 2011; Webb et al. 2011), including close proximity and shallow depth of epicentre, high stress drop (that is, a high energy event), and directivity of the fault rupture towards the city.
The June 2011 Christchurch earthquake
The epicentre of the Mw 6.0 earthquake on 13 June 2011 was located further to the east of the 22 February event (Figure 1). The June earthquake accompanied a rupture of a right-lateral strike-slip fault. As in the February 22 earthquake, ground accelerations in Christchurch were again very high, again associated with high stress drop, but not with the fault rupture directivity effects of February (Figure 7D).
Ground motion records for the 23rd December 2011 have not been analysed yet.
Ground deformation: uplift and subsidence, liquefaction, and slope failure
Uplift and Subsidence
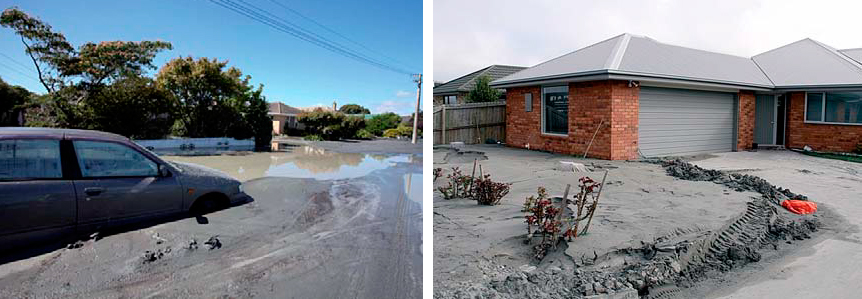
Land levels in the city area have been significantly changed as a result of the earthquake sequence. Two primary factors are responsible. There has been tectonic deformation from the blind reverse fault that ruptured in 22 February 2011 (shown as a dashed yellow line in Figure 1) resulting in uplift of up to 450 mm in the south of the city and southern hillside suburbs, and up to 150 mm of subsidence relative to sea level in coastal suburbs and along the lower reaches of the Avon River. Also lateral spreading and liquefaction (see more below) have resulted in up to 1 m of subsidence in some areas. Absolute changes in elevation with respect to see level have increased the flooding hazard in parts of the city.
Liquefaction
The February 22 earthquake was the most damaging event to Christchurch as a result of very high ground motions, and consequent extreme levels of liquefaction and lateral spreading (Cubrinovski and Taylor, 2011; Kaiser et al 2011). Christchurch is located on alluvial gravel deposits in the western suburbs, but from about the CBD to the coast the alluvial gravel units thin and many of the eastern suburbs are located on very recent (< 8000 years old), water-saturated, estuarine and fine-grained river sediments.
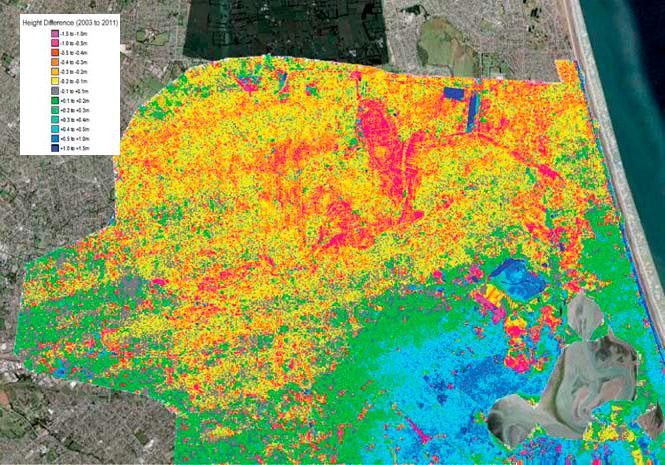
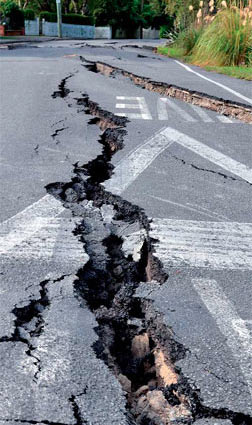
A range of liquefaction-induced phenomena were observed, including sand boils, lateral spread-induced settlement and rifting of structures of up to 3 m. Liquefaction occurred in a larger area (more than 50% of the city) than that predicted by pre-earthquake susceptibility maps, although the general indicators of susceptible areas were well known. The severity of the ground motions contributed to the extensive area of liquefaction, but also the threshold for damaging liquefaction occurrence was very low ground motions of only 0.1-0.15 g PGA in the most susceptible areas. Where lateral spreading occurred, the resulting damage to houses, underground services, and to foundations of multi-story buildings in the CBD has often resulted in a total loss (Figure 10).
Slope Failure
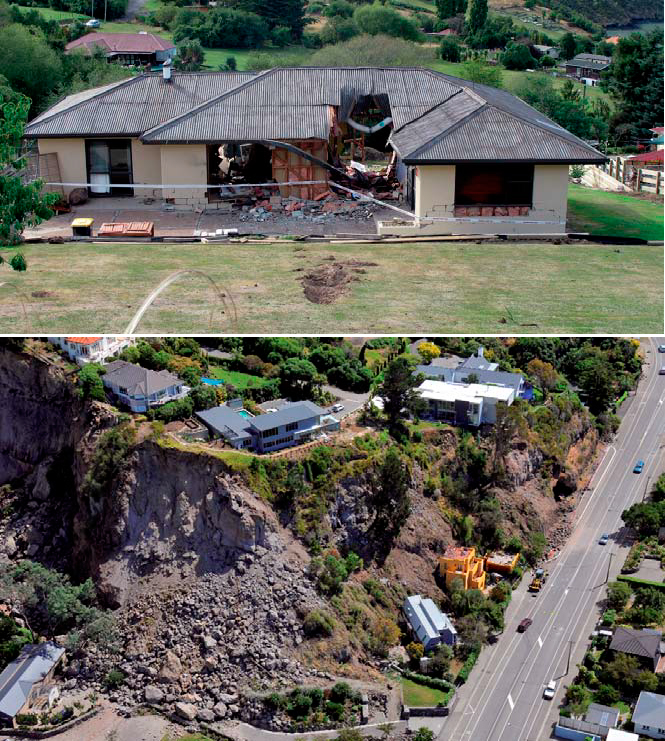
There were five fatalities in the 22nd February Christchurch earthquake as a consequence of rock fall. These were on the hillside suburbs to the south of the Christchurch CBD where urban development has extended onto the northern sector of the eroded extinct Lyttleton basaltic volcano. The rocks forming the 400-500 m high ridge, slopes, and sea cliffs of the area are about 10-12 million years old (Forsyth et al., 2008) They result in a blocky rock mass of variable composition (including hard and soft rocks) that periodically releases individual or multiple blocks of rock that roll down the face and accumulate as a talus at the base of slopes (Hancox et al., 2011). Many natural slopes around Lyttelton Harbour stand at relatively steep angles, and form near-vertical coastal cliffs. The steep modern coastal cliffs are near-vertical (~75–85°) and 15-30 m high in many places, and have been locally quarried in many places. Homes now occupy both the old quarry floors and the cliff tops.
There may not be sufficient business interruption insurance to cover what is expected to be an extended period before reconstruction can take place
At least 100 boulders triggered by the 22nd February earthquake hit houses and there was extensive cliff collapse (Figure 11). As a consequence, about 450 residential properties in the hillside suburbs were issued with “red placards”, meaning they were assessed as too dangerous to occupy. Further boulders crashed down the slopes and hit houses, and further cliff collapse occurred during the 13th June 2011. Currently a risk assessment is being undertaken to establish tolerable or intolerable life risk to the occupiers of the “red placard” houses measured against the probabilistic earthquake shaking model. Quantitative assessment will determin whether retreat in necessary, whether properties can be re-occupied after costeffective slope remediation, or establish that it is already safe to re-occupy the properties.
Damage to buildings and infrastructure
Residential Buildings
Most residential properties in the Christchurch region are one-story, an average of 150 m2, and are built of light timber framing on concrete slab or pile foundations in accordance with NZStandard 3604 (first published in 1978). Common roofing materials include light metal, clay, or concrete, tiles. Timber weatherboard, plastered stucco or unreinforced brick veneer is used for exterior cladding. Average house values in Christchurch, including land, is approximately NZD 300,0002.
Approximately 30,000 houses have suffered a total loss in the earthquake sequence (3/4 in the February event) largely due to liquefaction-induced structural deformation. Shaking damage was more widespread in both events (c. 150,000 in September 2010, and 170,000 in February 2011) but the damage levels were generally lower, typically involving repair costs of NZD 5,000- 60,000. This excessive level of damage due to liquefaction, coupled with the highly susceptible nature of foundation conditions in some suburbs, and the high likelihood of ground motions exceeding the trigger thresholds for further liquefaction in the design life for rebuilt properties in these suburbs, has led to the decision to retreat from some eastern Christchurch suburbs and other small areas. The total number of properties in this “red zone” number c. 6000, but the cost-benefit evaluation process of restoring the land to “good ground” condition and rebuilding in some further areas is not yet complete.
The earthquake shaking caused only limited structural damage to houses, but nonstructural damage was widespread. Chimney failure, brick fence collapse, and plasterboard cracks were common in all of the earthquakes of the Canterbury earthquake sequence. Damage has continued to accumulate in successive events where ground motion has exceeded 0.2 PGA.
Commercial Buildings
Concrete and Reinforced Masonry
Two reinforced concrete office buildings, one designed and built in the early 1960’s, the other in the mid-1980s, collapsed in the February, Christchurch earthquake resulting in more than two thirds of the 181 fatalities. At the same time, the majority of modern buildings performed well, even under the severe seismic loads corresponding to a c. 2500 year or longer return period motions. Variations in performance can be attributed to material type, year of construction, and differences in structural layouts, and variation in soil conditions and shaking (measured peak ground acceleration within the CBD varied from 0.36-0.72g) throughout the city.
Foundation types also varied in the CBD, ranging from shallow foundations to deep foundations with equal or unequal pile lengths and, in some cases, mixtures of shallow and deep foundations. Damage in concrete and reinforced masonry buildings was found in older as well as modern buildings, but was more prevalent in buildings constructed before the mid-1980s, when capacity design approaches were introduced in New Zealand.
URM buildings
Hundreds of unreinforced masonry (URM) buildings were heavily damaged or collapsed in the 22nd February earthquake, roughly two to three times the number similarly damaged in the 4th September earthquake. The number of deaths in URM buildings was probably reduced because a number of the buildings had been closed or cordoned off since September. Most URMs that had been renovated following seismic design (retrofitted URMs) before the 2010-12 events probably experienced ground motions well in excess of their design motions, and in some cases, higher-than-maximumconsidered earthquake motions, and their performances varied widely: 70% were cordoned-off to prevent public entry, and only 9% were assessed as safe to enter. In many cases, prior damage in the September earthquake and the many subsequent aftershocks affected performance in February. Notwithstanding the failures, however, damage was generally significantly lower in retrofitted URMs than in nearby unretrofitted URMs. Select heritage buildings that had been retrofitted to a high standard performed well.
Non-structural components
In the CBD, non-structural damage following the February earthquake was similar in many respects to the damage observed after the September earthquake. In office buildings and retail shops, there was typically damage to ceiling fixtures, overturned shelving, broken sprinkler pipes, and broke furniture and contents. An unexpected level of damage and indeed collapse of stairs in multistory buildings was of particular concern. A significant lesson emerging from the Canterbury earthquake sequence is the importance of non-structural performance in commercial buildings. Socio-economic impacts have occurred because of the lack of functionality of commercial buildings even though the structure has performed well.
Infrastructure
The level of seismic hazard in Canterbury is currently higher than the long-term average, and is likely to stay this way for several decades
There was extensive damage to lifelines, including potable water, wastewater, and drainage facilities, roads and highways, and electric power distribution in the Christchurch earthquake, much more so than in the larger, but more distant, Darfield earthquake. The damage was caused predominantly by liquefaction. The impact on the electric power distribution network in February 2011 was approximately ten times that of the September 2010 earthquake in terms of service disruption and damage to facilities. The electric power administration buildings were badly damaged in February. All major underground cables supplying large areas of eastern Christchurch failed, and over 50% of all major underground cables were damaged at multiple locations by liquefaction-induced ground movement.
Bridges, roads and railways
Most bridges in the Christchurch area are short spans of regular configuration and sometimes monolithic or well-restrained, and generally performed well during the earthquakes. Mostly, the only problems experienced were with settlement and lateral spread of the approaches, with consequent rotation of abutments. The road network, particularly in areas of liquefaction has been badly damaged, but is relatively easily repaired. The national network roads are largely outside the areas prone to liquefaction, so apart from discrete displacements of several metres across the surface trace of the Greendale fault, there was little disruption. The rail network was damaged in the 4th September Darfield earthquake by surface distortion where it crossed the north-eastern trace of the Greendale fault, and also where the approach to a rail bridge north of Christchurch suffered some lateral spread. Repairs in both locations took several days. No disruption has occurred in association with any of the other earthquakes of the sequence.
Socio-economic impacts and implications
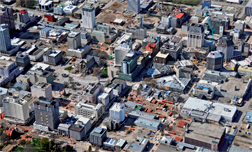
The 4th September 2010 earthquake mostly impacted the rural area west of Christchurch and the liquefaction susceptible eastern suburbs, and relatively small areas of the CBD where URM building damage was most severe. In contrast the 22nd February 2011 earthquake, and to a lesser extent the 13th June 2011 event were very much city events with major impacts in the eastern suburbs (again), the CBD, and the hillside suburbs south of the city.
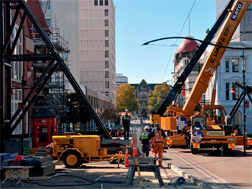
Within the CBD, an estimated 900 concrete and/or URM buildings sustained earthquake damage necessitating demolition, with this work needing to occur before reconstruction can begin. The majority of these buildings were relatively well insured by international standards, so flows of capital are likely to be available for rebuilding; however, this capital will not necessarily remain in Canterbury, with some reports indicating that some building owners may be looking to reinvest elsewhere in New Zealand. Further, there may not be sufficient business interruption insurance to cover what is expected to be an extended period before reconstruction can take place.
There were about 6,000 companies and/or institutions with over 50,000 employees in the CBD, or 25% of the total employment in the city. Of the 50,000 employees, 45% are in government, health care, or professions. These workers are likely to retain their employment, either in Christchurch or in another location. Other employees are in a variety of sectors including tourism, hospitality, retail, manufacturing, construction, wholesale, transport, communication, finance, insurance, and recreation. Many of these sectors have fared well, with Christchurch’s role as a hub for Canterbury’s regional, agriculturebased economy largely unaffected. While the tourism sector, in particular, may face rising unemployment, other sectors, such as construction, will be looking to significantly expand their workforces as the rebuild gets underway.
Unlike many post-disaster areas, disruption to economic activity from the earthquakes has not been significant at the aggregate level and official forecasts for the economic outlook in Canterbury are positive. Economic activity in Canterbury, according to the National Bank, rose by 1.9% in the June 2011 quarter, after a 2.5% contraction in the March 2011 quarter. Official forecasts in May 2011 showed New Zealand-wide economic growth rising to around 4 percent next year, with rebuilding activity adding around 2% growth next year. Overall, it is estimated that the rebuild will add around 8% to nationwide GDP over the next seven years.
The extended time period of the earthquake sequence has resulted in long term anxiety and concerns about safety, with the potential that widespread risk aversion may lead to unrealistic expectations of building performance in extreme events. Because of public perceptions of risk, code provisions that are limited to protecting life safety may be insufficient for future requirements in large cities, with the lessons learned in Christchurch, in geotechnical, structural engineering, and risk, also being noted across the country. Risk perception and the impact on international tourism, which accounts for 9% of New Zealand’s GDP, is also a concern.
New Zealand is unique in the structure of its earthquake insurance scheme for residential property. The Earthquake Commission (EQC) is a New Zealand Government agency which provides natural disaster insurance to residential property owners. The EQC provides home owners with building, contents and land damage insurance. In the event of a natural disaster, the EQC pays the lower of the repair cost or the value of a damaged house (to a maximum of NZD 100,000 for the building and NZD 20,000 for its contents), and also repairs or pays out on land damage up to its pre-event value. The EQC sustains the first NZD 1.5 billion of losses for a major event, before NZD 2.5 billion of reinsurance cover attaches. This first loss, and any liability beyond the reinsurance cover, is funded through the Government’s National Disaster Fund (also administered by the EQC). Before the Canterbury earthquakes this fund held approximately NZD 6.1 billion, but it is expected to become fully depleted as a result of the Canterbury events. If the EQC’s reinsurance and the National Disaster Fund are insufficient to cover the full damage costs from an event, any residual is implicitly guaranteed and covered by the Government. This Government guarantee will likely be called on as a result of the Canterbury events.
Communication in the aftermath of the February earthquake was a high priority for public officials faced with reassuring the population that effective measures were in place to restore infrastructure and protect lives. Government actions have been crucial to provide certainty and to assist with the rebuild of Christchurch and the surrounding areas. In addition to the funds paid out by the EQC, the Government set up the Canterbury Earthquake Recovery Fund (CERF), with budget of NZD 5.5 billion. Together with recently revised estimates of the EQC’s liability, total Crown earthquake spending is currently estimated at NZ$ 12.9 billion. In addition, the Government has set up a specialist agency, the Canterbury Earthquake Recovery Authority, to coordinate all aspects of the recovery.
Conclusions
During the 2010-12 earthquake sequence, Christchurch city experienced different levels of strong ground motions and, in some occasions, they exceeded design levels
The Canterbury earthquake sequence of 2010-2011 is widely regarded as the most serious natural hazard event in New Zealand in its European history of approximately 170 years, with impact costs of about 8% of annual GDP, approximately equal to the value of tourism to New Zealand on an annual basis. The impact, per capita, is 2-4 times the impact of Hurricane Katrina on the US economy.
Damage and socio-economic impacts in the region are largely as expected from what has been a very infrequent event, which is foreseen to impact Christchurch only once in several thousand years, on average. The on-going nature of the sequence has created a natural hazard event more akin to an extended volcanic eruption sequence than the usual earthquake pattern of mainshock (in which most of the damage is sustained) followed by an aftershock sequence. There remains a c. 10% likelihood of a further earthquake in this magnitude range in the coming year.
The extended period and continuing moderate likelihood of further earthquakes is impacting on the ability to purchase earthquake insurance cover for reconstruction because insurers and re-insurers have been taken large losses from this both infrequent and unusual sequence. The interaction between science, engineering, societal needs and expectations, business, insurance, reinsurance and government is complex where technical, social and financial obligations overlap in a rapidly evolving post-event recovery phase.
1 GNS Institute of Geological and Nuclear Sciences Limited: http://www.gns.cri.nz
2 1 EUR = 1,54 NZD; 1 USD = 1,25 NZD a julio 2012
References
Beavan, J., Fielding, E., Motagh, M., Samsonov, S., Donnelly, N. (2011). Fault location and slip distribution of 22 February 2011 Mw 6.3 Christchurch, New Zealand, earthquake from geodetic data. Seismological Research Letters: submitted June 2011.
Beavan, J., Tregoning, P., Bevis, M., Kato, T., and Meertens, C. (2002). Motion and rigidity of the Pacific Plate and implications for plate boundary deformation, J. Geophys. Res., 107(B10): doi: 10.1029/2001JB000282.
Beavan, R.J., Samsonov, S., Motagh, M., Wallace, L.M., Ellis, S.M., Palmer N.G. (2010). The Darfield (Canterbury) earthquake: geodetic observations and preliminary source model. Bulletin of the New Zealand Society for Earthquake Engineering 43(4): 228-235.
Berryman, K.R., Beanland, S., Cooper, A.F., Cutten, H.N., Norris, R.J., and Wood, P.R. (1992). The Alpine Fault, New Zealand, variation in Quaternary structural style and geomorphic express, Annales Tectonicae, 6: 126-163.
Cousins, W.J., McVerry, G.H. (2010). Overview of strong-motion data from the Darfield Earthquake. Bulletin of the New Zealand Society for Earthquake Engineering 43(4): 222-227.
Cox, S., and Sutherland, R. (2007). Regional geological framework of South Island, New Zealand, and its significance for understanding the active plate boundary, in: A Continental Plate Boundary: Tectonics at South Island, New Zealand, AGU Geophysical monograph series 175: 19-46.
Cubrinovski and Taylor, 2011. Liquefaction Map - Drive-through Reconnaissance, University of Canterbury NZ. www.nzsee.org.nz
EERI, 2011. M 6.3 Christchurch, New Zealand, Earthquake of February 22, 2011. EERI Special Earthquake Report - May 2011.
Forsyth, P., Barrell, D., and Jongens, R. (compilers) (2008). Geological Hazards. Pp. 53- 56 in: Geology of the Christchurch Area – Scale 1:250,000. Institute of Geological & Nuclear Sciences 1:250,000 Geological Map 16.
Fry, B., and Gerstenberger, M. (2011). Large apparent stresses from the Canterbury earthquakes of 2010 and 2011. Seismological Research Letters: submitted June 2011.
Fry, B., Benites, R., Reyners, M., Holden, C., Kaiser, A., Bannister, S., Gerstenberger, M., Williams, C., Ristau, J., Beavan, J. (2011a). Extremely strong shaking in the New Zealand earthquakes of 2010 and 2011. Eos Transactions, American Geophysical Union, submitted.
Gerstenberger, M. C., McVerry, G., Rhoades, D. A., Stirling, M. W., Berryman, K., Webb, T. (2011). Update of the Z-factor for Christchurch considering earthquake clustering following the Darfield earthquake, GNS Science Report 2011/29 19 p.
Gerstenberger, M., Wiemer, S., Jones, L.M., and Reasenberg, P.A. (2005). Real-time forecasts of tomorrow’s earthquakes in California, Nature 435: 328-331.
Landslides caused by the 22 february 2011 Christchurch earthquake and management of landslide risk in the immediate aftermath. Dellow, G., Yetton, M., Massey, C., Archibald, G., Barrell, D. J. A., Bell, D., Bruce, Z., Campbell, A., Davies, T., De Pascale, G., Easton, M., Forsyth, P. J., Gibbons, C., Glassey, P., Grant, H., Green, R., Hancox, G., Jongens, R., Kingsbury, P., Kupec, J., Macfarlane, D., Mcdowell, B., Mckelvey, B., Mccahon, I., Mcpherson, I., Molloy, J., Muirson, J., O’halloran, M., Perrin, N., Price, C., Read, S., Traylen, N., Van Dissen, R., Villeneuve, M., Walsh, I.
Bulletin of the New Zealand Society for Earthquake Engineering [Bull. New Zealand Soc. Earthq. Eng.]. Vol. 44, no. 4, pp. 227-238. Oct 2011.
Holden, C., Beavan, J., Fry, B., Reyners, M., Ristau, J., Van Dissen, R., Villamor, P., Quigley, M. (2011). Preliminary source model of the Mw 7.1 Darfield earthquake from geological, geodetic and seismic data. In: Proceedings of the Ninth Pacific Conference on Earthquake Engineering, 14 – 16 April, Auckland, New Zealand, paper no. 164.
McVerry, G.H., Zhao, J.X., Abrahamson, N.A., Somerville, P.G. (2006). New Zealand acceleration response spectrum attenuation relations for crustal and subduction zone earthquakes. Bulletin of the New Zealand Society for Earthquake Engineering 39(1): 1-58.
Norris, R.J., and Cooper, A.F. (2001). Late Quaternary slip rates and slip partitioning on the Alpine Fault, New Zealand, J. Structural Geol., 23: 507-520. Pettinga, J., Chamberlain, C., Yetton, M., Van Dissen, R., Downes, G. (1998). Earthquake Hazard and Risk Assessment Study, Stage 1 (Part A) Earthquake Source Identification and Characterisation. Report prepared for Canterbury Regional Council, Rivers and Coastal Resources, and Hazards Section by. CRC Publication Number U98/10 - March 1998. Pettinga, J.R., Yetton, M.D., Van Dissen, R.J., Downes, G.L. (2001). Earthquake source identification and characterisation for the Canterbury region, South Island, New Zealand. Bull. of the N.Z. Soc. for Earthquake Engineering, 34(4): 282-317.
M. Quigley, R. Van Dissen, N. Litchfield, P. Villamor, B. Duffy, D. Barrell, K. Furlong, T. Stahl, E. Bilderback and D. Noble, 2012, Surface rupture during the 2010 Mw 7.1 Darfield (Canterbury) earthquake: Implications for fault rupture dynamics and seismic-hazard analysis Geology v. 40 no. 1 p. 55-58 ; doi: 10.1130/G32528.1
Quigley, M., Villamor, P., Furlong, K., Beavan, J., Van Dissen, R., Litchfield, N., Stahl, T., Duffy, B., Bilderback, E., Noble, D., Barrell, D., Jongens, R., Cox, S. (2010). Previously unknown fault shakes New Zealand’s South Island. Eos, Transactions, American Geophysical Union 91(49): 469-471.
Reyners, M. (2011). Lessons from the destructive Mw 6.3 Christchurch, New Zealand, Earthquake. Seismological Research Letters 82(3): 371-372.
Rhoades, D.A., and Evison, F.F. (2004). Longrange earthquake forecasting with every earthquake a precursor according to scale. Pure and applied geophysics, 161(1): 47-72.
Stirling, M.W., McVerry, G.H., and Berryman, K.R. (2002). A new seismic hazard model for New Zealand. Bulletin of the Seismological Society of America 92: 1878-1903.
Wallace, L.M.; Beavan, R.J.; McCaffrey, R.; Berryman, K.R.; Denys, P. 2007 Balancing the plate motion budget in the South Island, New Zealand using GPS, geological and seismological data. Geophysical journal international, 168(1): 332- 352; doi:10.1111/j.1365-246X.2006.03183.x
Webb, T.H. (compiler); Bannister, S.; Beavan, J.; Berryman, K.; Brackley, H.; Fry, B.; Gerstenberger, M.; Holden, C; Kaiser, A; McVerry, G.; McSaveney, E.; Pettinga, J.; Reyners, M.; Rhoades, D; Somerville, P; Stirling, M; Van Dissen, R.; Villamor, P.; Wallace, L. and Zhao, J., 2011. The Canterbury Earthquake Sequence and Implications for Seismic Design Levels, GNS Science Consultancy Report 2011/183, 88 p.


