Calculating capital under QIS5Financial
Dr. Eduard Held
Head of Sales and Products at PERILS
Zürich - Switzerland



In an effort to contribute to a greater understanding of the capital requirements for natural catastrophes in QIS5, PERILS calculated the gross property windstorm scenario losses for the nine markets it covers.
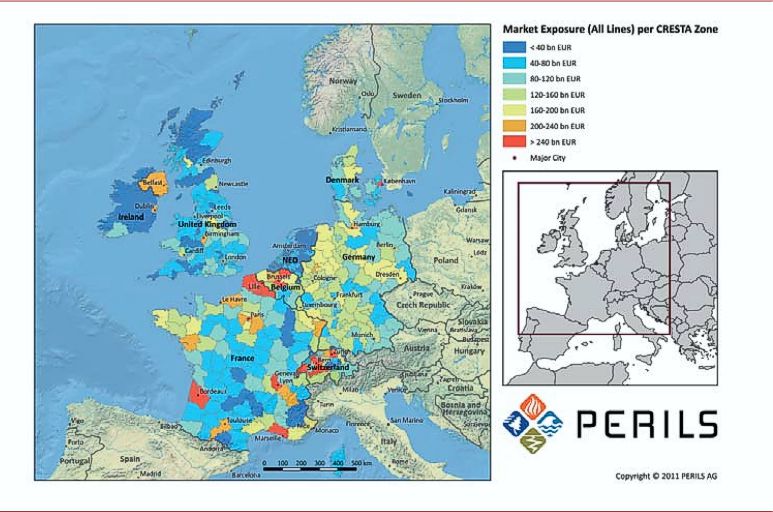
PERILS is an insurance industry initiative that was set up in 2009. It provides the first independent source of windstorm industry exposure and industry event loss data for eleven European countries on a CRESTA zone level (see Figure 1), which it has amassed through cooperation with over 80 insurance companies in those markets: Belgium, France, Denmark, Germany, Ireland, Luxembourg, Norway, Sweden, Switzerland, The Netherlands and United Kingdom. The QIS5 calculations are based on PERILS Industry Exposure Database 2010. The market-wide sums insured data is available per CRESTA zone, property occupancy type and coverage type.
Solvency II and Natural Catastrophes
Perils provides the first independent source of windstorm industry exposure and industry event loss data for eleven European countries on a CRESTA zone level
As Europe moves closer to the Solvency II Directive, due for implementation on 1 January 2013, PERILS has played its part in computing gross property windstorm scenario losses for the nine European markets it covers (two more, namely Norway and Sweden have been added since the time of writing). The computations were carried out as part of the most recent impact study (QIS5), and were released in October 2010, in an effort to aid the insurance and reinsurance industry in understanding gross natural catastrophe risk exposures, as this influences what levels of capital it will need under the new regime. For non-life insurance and reinsurance companies, natural catastrophe risk is expected to be one of the main drivers for capital requirements under the Solvency II regime.
From a pan-European perspective, the wind-storm peril tops the list of catastrophe loss potentials because of the large geographi-cal footprint a major event of this type could have. It is therefore essential for regulators and market participants alike to have a clear understanding of the potential market impact caused by such a low probability/high impact windstorm event.
The fifth impact study, run by the European Insurance and Occupational Pensions Autho-rity (EIOPA) from August to November 2010, is significant because it has had the widest participation from the industry to date. 70% of insurers and reinsurers took part com-pared with just 33% in QIS4. The purpose of the study was to test different scenarios and parameters under Solvency II in order to pro-vide the European Commission with empirical data so that it can correctly calibrate the new framework’s technical rules.
The results of QIS 5, released on 11 March 2011, indicate that in aggregate European companies hold excess capital to what will be required under Solvency II (EUR 395 bn of capital in excess to solvency capital requi-rements and EUR 676 bn in excess to mini-mum capital requirements). However, some actuarial experts believe QIS5 remains over calibrated and there is a particular concern relating to how re/insurers with non European catastrophe exposures will be treated. EIOPA is performing some additional work to improve the calibrations.
QIS5 windstorm scenario losses
The results of QIS 5, released on 11 March 2011, indicate that in aggregate European companies hold excess capital to what will be required under Solvency II
PERILS’ loss estimation using the QIS5 scenarios aims to contribute to the overall understanding of industry capital requirements. In particular, PERILS hopes that the European windstorm loss results will contribute to a well-founded debate of the quantitative impact of the upcoming Solvency II regime and implications from a capital and reinsurance perspective.
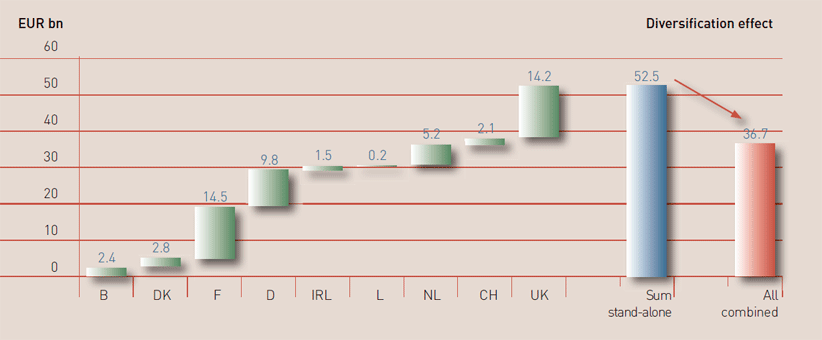
Comparing QIS5 industry scenario loss with actual losses from windstorm Lothar (not indexed to today’s values), the figure of EUR 36.7bn is six times the loss incurred from this particular windstorm
By applying the windstorm scenarios of the QIS5 to these market exposures PERILS was able to estimate potential losses and related capital charges for a large Euro-pean windstorm. The nine markets covered in the exercise Belgium, Denmark, France, Germany, Ireland, Luxembourg, the Netherlands, Switzerland and the United Kingdom are the main contributors to a large, Probable-Maximum-Loss (PML) storm event in Europe.
The resulting scenario losses are shown in Figure 2 and represent for each country an estimate of the insured property gross occurrence loss from a windstorm expected to happen once in 200 years. In other words, these are the gross occurrence-based property losses the entire insurance and reinsurance industry will have to absorb for a specific country after an event occurring once in 200 years. The figures are also an indication for the overall property catastrophe capital charge in the upcoming Solvency II specifications.
The combined total for Europe -the figure of EUR 36.7bn- represents the total windstorm capital charge within Solvency II for all the nine markets mentioned, including geographical diversification benefits. It is important to note that the calculated QIS5 windstorm occurrence losses are indications only. Final technical specifications under Solvency II for non-life natural catastrophe risk may differ from the current QIS5 parameters.
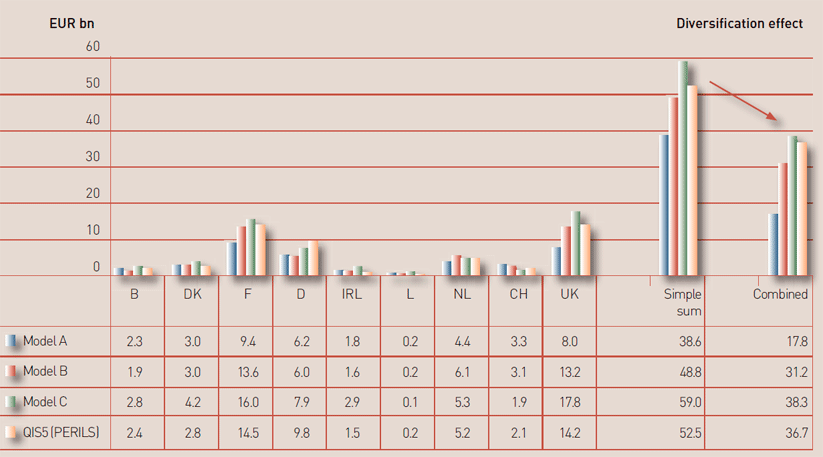
For insurance and reinsurance companies not using the standard formula approach under Solvency II, internal models or commercially available vendor natural catastrophe models (from catastrophe modelling companies such as RMS, AIR and EQECAT) can substitute the Solvency II calculation for non-life catastrophe risk. A comparison of the resulting losses (i.e. charges) based on the three main vendor models with the charges from QIS5 is shown in Figure 3. All calculations are based on PERILS’ industry exposure data. The chart shows that while the differences can be significant, the QIS5 charges are within the same range as those derived from the vendor catastrophe models.
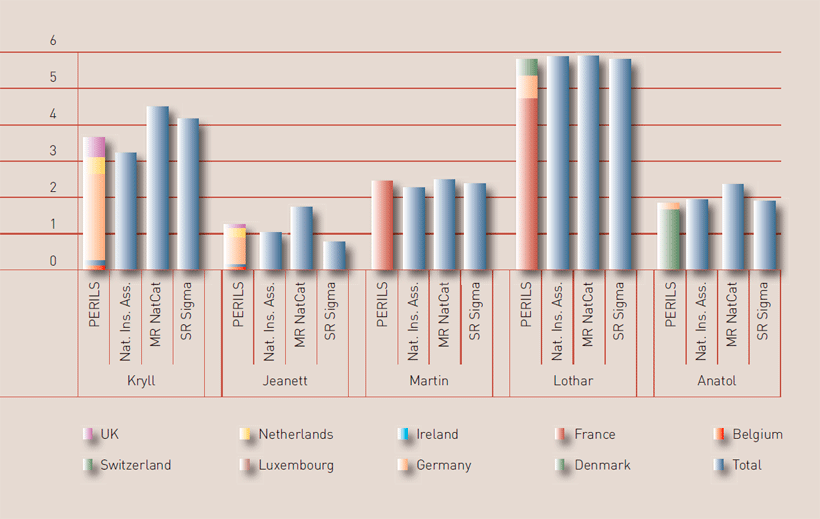
It is also insightful to look at the largest windstorms that have occurred over the last ten years and to compare total industry property losses from these events for all nine markets under consideration. Significantly, comparing QIS5 industry scenario loss with actual losses from windstorm Lothar (not indexed to today’s values), the largest event since 1999, reveals that the figure of EUR 36.7bn is six times the loss incurred from this particular windstorm.
There is no doubt that QIS5 was a worthwhile exercise as the industry gets to grips with the likely impact of Solvency II and the regulators draw appropriate lessons from the study, which will be reflected in the amendments to the Level 2 implementing measures. However, it is clear from PERILS’ calculations that more work will help in better understanding the impact of low probability/high severity catastrophe events and how they will affect industry capital requirements. It is therefore encouraging that EIOPA is conducting further analysis into this area. This work will take into consideration the results of its QIS5 study and it is expected that a proposal for the Solvency II level 2 implementing measures will be published by the end 2011.
| Year in which PERILS was incorporated (initiated by the Chief Risk Officer Forum). | 2009 |
|---|---|
| Number of data providing companies. | >80 |
| PERILS’ overall market coverage per August 2011. | >50% |
| Number of countries covered by PERILS: Belgium, Denmark, France, Germany, Ireland, Luxembourg, Netherlands, Norway, Sweden, Switzerland, United Kingdom. | 11 |
| PERILS final property loss estimate for windstorm Xynthia (Feb 2010). | EUR 1.32 bn |
| PERILS final property loss estimate for windstorm Klaus (Jan 2009). | EUR 1.57 bn |
| Total Cat capacity placed Jan 2010 to August 2011 based on PERILS loss index. | EUR 2.79 bn |


