
The 8.8 magnitude Maule, Chile,
earthquake
Seismological
review and field
survey observationsNATURAL PERILS
John E. Alarcon. MEng (Civil Eng), MSc, PhD DIC
Research Associate
AIR Worldwide (London, UK)
Guillermo Franco. Civil Eng, MSc, PhD
Principal Engineer
AIR Worldwide (Boston, USA)
In 2010, a number of largemagnitude earthquakes hit populated areas, causing widespread destruction, large numbers of casualties, significant economic damage and high insured losses. Of these events, the Maule, Chile, earthquake of 27th February caused the greatest damage in terms of economic losses. This article addresses some of the seismological aspects related to this earthquake, describes the challenges of modelling the event for damage and loss estimation purposes, and presents some results from field observations obtained shortly after the earthquake. The article briefly explores how this event may have changed the seismic setting and the potential for future events in the Chilean region.
Introduction
Thus far, 2010 has seen a substantial number of earthquakes affecting urban populations. The first of these events took place on 10th January when a moment magnitude (Mw) 6.5 earthquake struck Northern California. Although the event occurred offshore and did not cause significant damage, it was a reminder to Californians and the insurance community of the high seismicity in the region. Two days later, on 12th January, Haiti was struck by a shallow earthquake that occurred close to its capital, Port-au-Prince. The 7.0 Mw event produced extensive damage to the city and a death toll of about 222,000 people. More than a million people were made homeless (USGS1, 2010). A month and a half later, on 27th February, a powerful 8.8 Mw earthquake impacted a large swath of central Chile and, in particular, the Bío-Bío, Maule and Araucanía regions. The earthquake caused damage to the city of Concepción, the second largest populated urban area in the country. While claims are still developing, total insurance losses are expected to be high.
Other earthquakes of significance occurring during the course of the year were the 6.3 Mw event of 4th March in Taiwan that, while causing no major destruction, it reminded the population of the devastating 1999 Chi- Chi earthquake; the 6.1 Mw of 8th March in Karakocan, Turkey; the 7.2 Mw of 4th April in Baja California that resulted in considerable damage to Mexicali, the capital of the Baja California state in Mexico; and most recently, the 7.0 Mw earthquake on 4th September in Christchurch, New Zealand, where large losses are expected to be partly paid out by the EQC (the New Zealand Earthquake Commission, which provides insurance coverage for natural disasters affecting residential property).
What is really important for damage estimation is how close the exposures of interest are to the ruptured plane, than to the earthquake’s epicentre
The unusual number of events affecting urban populations is not the result of an increment in the world seismicity during 2010, but is rather a consequence of the expansion of urban centres and hence, a larger exposure of urbanised areas to natural perils. Considering the importance of the Maule, Chile, earthquake for the (re)insurance market, this article reviews some seismological details of the event, the damage observed during a field survey, and briefly describes how this event may have influenced the seismic hazard in the region with respect to future earthquakes.
Event description
At 3:34 am local time (6:34 am UTC), a moment magnitude (Mw) 8.8 earthquake, occurring off the coast of central Chile, struck the regions of Valparaíso, Santiago Metropolitan area, O’Higgings, Maule, BíoBío and Araucanía, causing extensive damage in Central Chile. The area affected by the earthquake roughly covered 700 km along the coast and reached 100 km inland. The seismic energy released during this event is about 22 times the energy released during the 7.9 Mw Pisco, Perú, earthquake of 2007, about 500 times the energy from the 7.0 Mw Haiti earthquake of 2010, and about 7,940 times the energy released during the 6.2 Mw L’Aquila, Italy, earthquake of 2009.
The damage caused by the ground motions was exacerbated in coastal areas by the tsunami that followed, which produced waves of up to 11 metres high. In Chile, where the higher tsunami run-ups were measured, the average wave height amongst 23 measurements was about 3.7 metres (NGDC2, 2010). Even though the epicentre of the event (i.e. the point projection on the surface of the Earth of the point releasing the largest amount of energy during an earthquake) was initially located at 107 km from the city of Concepción and 328 km from Santiago de Chile, though the distances from these cities to the earthquake fault rupture plane were much smaller.
The earthquake-induced ground shaking was of very long duration (about 140 seconds) with the strongest part of it lasting between 40 to 50 seconds (see Figure 1). The induced horizontal accelerations in Concepción were recorded as up to 6.4m/s2 or roughly 65% of Earth’s gravity. This means that some buildings in Concepción may have received, for a fraction of a second, lateral forces equivalent to 65% of their vertical weight.
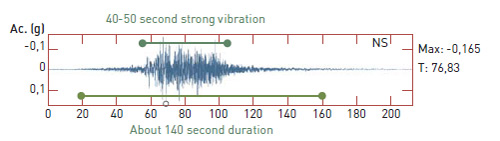
Figure 1. Ground Motion recording from the Maule, Chile,
earthquake
Total duration of the ground shaking was about 140 seconds with
the strongest part lasting 40 to 50 seconds. Source: RENADIC (Red
Nacional de Acelerógrafos de la Universidad de Chile - University
of Chile National Network of Accelerographs)
The length and intensity of the ground shaking caused damage to structures ranging from old adobe houses to modern buildings made of reinforced concrete. The Chilean housing minister initially estimated 1.5 million houses to have been damaged to some degree, though more recent information from the Chilean government estimates this number on the order of 370,000. In most cases, damage to engineered buildings was largely restricted to non-structural elements, pointing to Chile’s history of good design codes and construction practices. However, it must be noted that a small number of engineered buildings suffered severe or partial collapse. The earthquake also severely affected infrastructure, including roads, bridges, airports, utilities and telecommunication networks.
Tectonic setting
Chile is located on the so-called “Pacific Ring of Fire”, which in essence represents the boundary between oceanic and surrounding continental tectonic plates in the Pacific Ocean. In general terms, the thinner and denser oceanic plates are subducted below the thicker but lighter continental ones (see Figure 2).
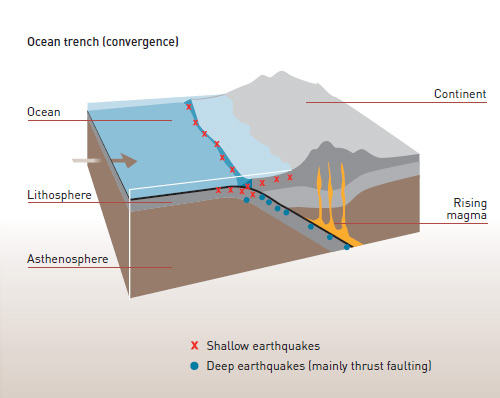
Figure 2. General subduction process
The oceanic plate (left hand side plate) is pushed below the thicker
continental plate (right hand side one). The collision of these plates
deforms the continental plate, a process that often creates mountains
ranges. Source: Bolt (2003)
The Pacific Ring of Fire (ROF) extends 40,000 km from Chile in South America to New Zealand in the Western Pacific (see figure 3). The collision of these enormous tectonic plates implies vast amounts of energy being accumulated and then suddenly released by what is known as an earthquake. The largest proportion of this energy is converted into heat and permanent deformation, as in the formation of mountains. Only about 5% of the total energy released is transformed into ground-shaking. The largest instrumentally recorded earthquakes have occurred in the Pacific Ring of Fire, and it is estimated that about 75% of the total seismic energy produced in the world per year is released along the ROF. Figure 3 also shows the ten largest instrumentally recorded events in the world, all of them located on the ROF. The largest recorded earthquake took place in 1960 in Chile, at 9.5 Mw, while the 2010 Maule earthquake ranks fifth.
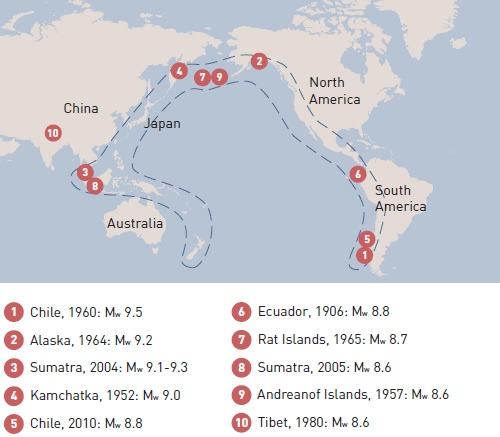
Figura 3. The largest recorded earthquakes have been produced
in the Pacific Ring of Fire
The figure shows the 10 largest recorded events with year of occurrence
and magnitude; the Maule earthquake is listed in fifth place. Source: AIR
The tectonic plates involved in the Ring of Fire collision in Chile are the oceanic Nazca plate and the continental South American plate. The Nazca plate is being subducted under the South American plate at a rate of about 80 mm per year. The Antarctic oceanic plate is also subducting beneath the South American plate in the southernmost part of Chile, though at a rate of 20 mm year and hence, the seismic activity in this region is much lower than along the Nazca-South American plate boundary.
Since 1973 Chile has been affected by thirteen earthquakes with magnitudes equal to or larger than 7.0 and Concepción, in particular, had already been severely affected during the 1939 7.6 Mw earthquake. Figure 4 shows the locations and magnitudes of the ten largest historical events in Chile prior to the Maule earthquake in terms of estimated losses if they were to recur today (AIR, 2009).
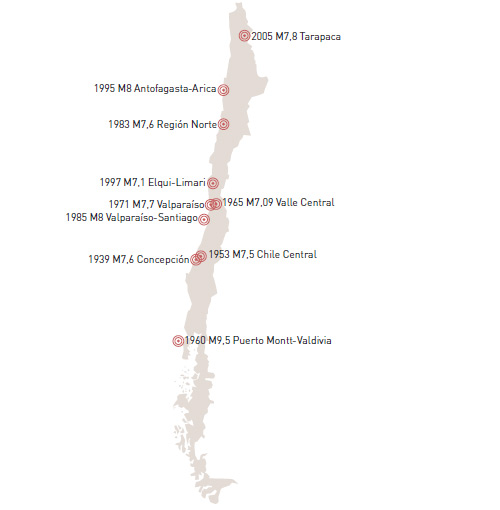
Figure 4. Locations of the ten largest historical earthquakes in terms of estimated losses were they to recur today (Source: AIR, 2009)
The challenges of modelling the Maule event
Estimating the damage caused by an earthquake in real time involves the assessment of the relevant seismological parameters (i.e. magnitude, the type and location of the event, and the geometry of the fault rupture as primary parameters), how the seismic energy released transits through the earth, the particular response of the type of soil at each particular site, the age of the building/infrastructure under assessment and the quality of the design and construction of the affected structures, among others. This section focuses on the challenges related to the assessment of the seismological parameters shortly after the event.
Table 1 provides the location of the epicentre given as latitude and longitude, the depth of the event (focal depth) and magnitude assigned by four different and respected seismological agencies from Chile, Germany, USA and Europe. The data listed was issued soon after the event occurred, and was published on the internet on 2nd March, three days after the main shock.
| Agency | Epicentral location | Focal depth (km) |
Magnitude Mw | |
|---|---|---|---|---|
| Latitude (S) | Longitude (W) | |||
| UCSC (Chile) | 36,208 | 72,963 | 47,4 | 8,3 |
| EMSC (Europe) | 35,89 | 73,04 | 30 | 8,8 |
| GFZ (Germany) | 36,04 | 72,66 | 30 | 8,3 |
| USGS (EE.UU.) | 35,846 | 72,719 | 35 | 8,8 |
Notes: UCSC – University of Chile Seismological Centre; EMSC – European- Mediterranean Seismological Centre; GFZ – German Research Centre for Geosciences; USGS – United States Geological Survey
The first striking difference comes from the magnitudes initially assigned, for which the UCSC (Chile) and the GFZ (Germany) provided initial estimates of 8.3 Mw, compared to the 8.8 Mw given by the USGS (USA) and the EMSC (Europe). This represents a difference of 5.6 times the size of the earthquake in terms of the energy released. Even though the 8.3 magnitudes were updated to 8.8 later on, this highlights the relevance of these initial differences in the estimation of damage and losses within 24 or 48 hours of the event.
The second divergence arises from the estimation of the epicentral location, where differences of up to about 50 km can be calculated from the table. Even though the estimation of the ground motion intensity induced at a certain distance from a seismic source is very complex, and includes the evaluation of soil conditions, topographical effects and rupture directivity among others, a difference of 50 km can have very different consequences. All factors such as soil conditions being the same, in general, a moderate magnitude earthquake (e.g. around 6.5 Mw) being 50 km closer or farther from the epicentre may represent the difference between the total collapse and just light or no damage induced to a particular structure. While this example is a generalization, and the correlation between damage and epicentral distance is not quite so direct, the discrepancies in the estimated epicentral location soon after the event illustrates the uncertainties in the determination of seismic parameters.
Design codes in earthquake-prone countries have been implemented and updated based on lessons learned from past damaging events
The third parameter in Table 1 is the focal depth, which from the seismological point of view is the most difficult factor to determine with any level of accuracy and, hence, differences of around 10 km are usually found in published data from diverse seismological agencies.
The final aspect related to the Maule earthquake parameterisation is the definition of the actual fault rupture geometry which, together with the magnitude, is the most important parameter for the characterisation of an earthquake. It is also one of the most challenging to quantify. An earthquake is not a single point inside the Earth (i.e. the hypocentre) releasing energy, but it is actually a full plane or area of contact between two tectonic plates (or two sides of an active fault) moving suddenly relative to one another in a very rapid displacement. In a subduction environment, this sudden slip between plates releases the energy accumulated through the collision of the tectonic plates. It is worth noting that this accumulation of energy occurs over decades, hundreds or even thousands of years before an earthquake is triggered.
The size of the ruptured plane varies proportionally with the size of the earthquake. The 7.0 Mw Christchurch, New Zealand, earthquake of September 2010, for example, ruptured a plane about 35 km long, while the 8.8 Mw Maule earthquake ruptured a plane about 450 km long. The estimated length of the plane ruptured during the 1960 9.5 Mw Chile earthquake was about 1,000 km.
Figure 5 presents the estimated ruptured planes for the Maule earthquake as reported by the United States Geological Survey (USGS), the University of California (UCSB) and the Earthquake Information Centre (EIC) from Japan. The rectangles in each figure represent the projection on the surface of the Earth of the earthquake plane ruptured, while the colours represent the degree of rupture slip (i.e. the larger the slip the greater the amount of seismic energy released in that portion of the fault rupture). The EIC figure does not present a colour scale but lines that join points with similar slip. These lines are similar to isoseismic lines of damage, or to isobar lines in a weather map.
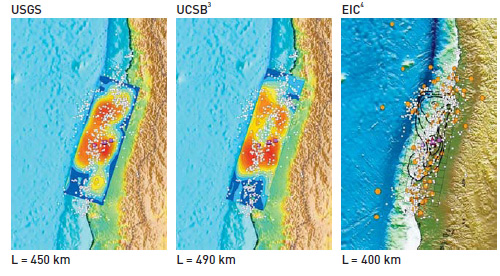
Figure 5. Estimated fault plane ruptures reported by three seismological
agencies: USGS (left), UCSB (centre) and EIC (right).
The rectangles in each figure represent the projection on the surface of
the Earth of the earthquake fault rupture. Red colours represent areas of
larger slips (i.e. larger releases of energy) while blue colours represent
areas of the fault rupture with lower slips. The thick black lines in the EIC
solution join areas of similar slip (Source: AIR)
3University of California. Santa Bárbara
4Earthquake Information Centre from Japan
The estimated ruptured lengths from the USGS, UCSB and EIC are 450, 490 and 400 km respectively. Additionally, note that the location of the ruptured plane from the UCSB extends further to the North-East as compared with the USGS solution, thus placing the fault plane closer to Santiago, Chile’s capital. These results mean that using the latter scenario for damage and loss estimates will produce much larger estimates than using the USGS fault plane solution. Based on the previous discussion, it can be concluded that what is really important for damage estimation is how close the exposures of interest (e.g. buildings or infrastructure) are to the ruptured plane, than to the earthquake’s epicentre.
In the end, the complexities involved in the determination of seismological parameters for rapid damage estimation are considerable, as is the amount of uncertainty involved in such assessment. How these uncertainties are dealt with is beyond the scope of this article.
Structural behaviour of buildings
Days after the Maule earthquake struck Chile, AIR Worldwide organised a damage field survey partly in collaboration with the Earthquake Engineering Research Institute (EERI). This section provides an overview of the structural behaviour of buildings in Chile during the earthquake and a brief history of the evolution of Chilean design and building practices.
Field Survey Observations
The team visited an area affected by the earthquake extending about 600 km along the coast and 100 km inland. Among the locations visited were Santiago, Valparaíso, Viña del Mar, Talca, Constitución, Concepción and Dichato.
In terms of damage to non-insurable buildings, an example of their structural behaviour was observed in the historical centre of Talca, the capital of the Maule Region. Here, residential buildings were predominantly made of adobe. About 1,500 adobe homes were either destroyed or were undergoing demolition at the time of the survey (Figure 6). These dramatic effects on adobe houses were also observed during the 2007, Pisco, Perú earthquake (Alarcon et al., 2008), highlighting the extreme vulnerability of unreinforced adobe to the lateral forces induced by the earthquake.
With respect to engineered buildings (considered, in general, as insurable), the majority of structures behaved very well, with only some exceptions. Examples of severe damage were observed in Concepción, where several structures will have to be demolished due to partial collapses at localised floors. At the time of the visit, the city’s municipality considered that a total of eight buildings had to be torn down, while an additional 48 would require in-depth inspections to assess whether they can be repaired. Currently, the number of buildings scheduled for demolition has generally increased, including those buildings that suffered severe although localised damage to their structures.
Although detailed studies are underway to discern the precise reasons why some modern structures failed in this earthquake, based on field observations it seems that the lack of vertical regularity might have been a key driver.
In general, vertical irregularities may appear in a structure due to set-backs in the upper floors or due to the differences in stiffness of vertical elements. One such case is the practice of reducing the cross-section of the vertical shear walls at the parking levels in order to provide more space for the manoeuvrability of automobiles. This induces a concentration of compression and tension stresses at these levels that, compounded with the flexion experienced during the earthquake, might have triggered the failure of vertical elements.
In Chile, engineered buildings significantly rely on shear walls. These are massive reinforced concrete walls within the structure that are designed to resist a large proportion of the lateral forces imposed by an earthquake. Much of the modern building stock performed well, but there were exceptions where buildings suffered a partial collapse of concrete shear walls (Figure 9). Inspection of the longitudinal reinforcement of the walls suggested that the steel bars had suffered buckling due to excessive compressive stresses at the edges of the walls and due to insufficient confinement of the concrete. The confinement of the concrete at the edges of shear walls is typically known as a “boundary element” and it provides the wall with a higher capacity to resist earthquake loads. The absence of these boundary elements may have been largely responsible for the failure of vertical elements (see Figure 10).
The Chilean Design Code
As expected in earthquake-prone countries, design codes in Chile have been implemented and updated based on lessons learned from past damaging events. In other words, earthquakes that have hit areas where no previous design code existed induce significant damage to vulnerable structures not constructed to withstand the shaking and this leads to the revision of building practices. Once a new code is implemented, subsequent earthquakes will again highlight the shortcomings of new designs and through this iterative process a more resilient building stock ensues. Note that this evolutionary process can also be affected by gaps in the enforcement of building practices or by the introduction of new materials or techniques that can also result in the appearance of new vulnerabilities.
As described above, Chile has experienced a high number of large magnitude earthquakes and, as a result, the Chilean design code has been updated on a number of occasions. The first such code was implemented was in the 1930s after the 1928 7.6 Mw Talca earthquake. Further revisions to the code were triggered after the 1939 Chillán earthquake, the 1960 Valdivia event (the largest earthquake ever recorded instrumentally) and the Valparaiso earthquake of 1985. Figure 11 summarises these events and the corresponding dates when updates were implemented to the code.
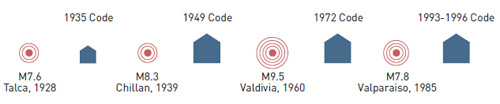
Figure 11. Evolution of the Chilean design code
The dates on top of the figure show the year of the updates, while dates at the bottom show the
earthquakes that triggered the updates. The relative size of the structures reflects the
comprehensiveness of the revision. (Source: AIR)
Today, Chile’s reinforced concrete design code is a very stringent one, essentially a local adoption of the United States ACI318-95 code, with a few exceptions.
One such exception is related to not having fully implemented the US code concerning boundary elements in shear walls. This decision was made due to the historical practices of building strong and large crosssection vertical walls that had performed excellently in past events. However, this lack of boundary elements in conjunction with the continuous reduction of the cross-sectional area of walls for architectural reasons has been pointed out during the analysis of this event as one of the potential causes of the damages observed to the modern building stock.
Chile has been quick to react to the lessons learned from the Maule earthquake (Franco and Siembieda, 2010). One of the most salient examples is a new draft for the amendment of the building code that revises the implementation of boundary elements, as well as increases in the design demands. The draft is scheduled for final governmental approval soon.
Future earthquake hazard
Reliable seismic hazard evaluation involves very complex processes and requires several data as input that may not be available everywhere in the world. Where high quality information is available, the understanding of the regional seismicity is greatly improved but significant uncertainties nevertheless remain. No seismic “prediction” can be carried out with current technology. Instead, one must rely on probabilistic evaluations of the potential frequency and intensity of future events. Not surprisingly, the potential for future earthquakes in Chile remains a topic of study. This section depicts, at a high level, the potential influence that the Maule earthquake may have induced in the seismicity in the region.
With respect to future seismic hazard in Chile, it is important to address the notion of a “seismic gap”, which can be defined as an area in an active seismic region where the accumulation of stresses has occurred over a long period, but where no major earthquake has occurred recently and thus an event is considered “due”. The Maule earthquake released energy that had been accumulated for about 170 years, filling in a previously observed seismic gap in the region. For this particular area and based on GPS measurements, Ruegg et al. (2009) had estimated that an event around Concepción with magnitude between 8.0 to 8.5 may have been due to occur. The Mw 8.8 Maule earthquake was even larger than Ruegg et al. (2009) had estimated.
A new draft of the Chilean Building Code that increases the design demands is scheduled for final governmental approval soon
As a consequence of the energy released during the Maule earthquake, tectonic plate stresses may have been transferred to the fault segments located immediately North and South from the rupture plane (see Figure 5). If so, this would suggest that the occurrence of an earthquake on these segments is now more likely. However, in this respect Shen-Tu and Mahdyiar (2010) point out the fact that large magnitude events have already occurred recently (within about 70 years) on these segments, and hence these may not yet be sufficiently “mature” to rupture again with a large magnitude earthquake in the short term. With respect to other regions in Chile, Shen- Tu and Mahdyiar (2010) highlight the existence of two potential seismic gaps further North from the Maule region, in the Arica and Tarapacá regions, close to the border with Perú. The last time a large magnitude event occurred in these regions was in 1868 and 1877, with corresponding magnitudes of 8.8 Mw and 8.3 Mw, respectively.
Further details on the assessment of earthquake risk after the February 2010 event are available in Shen-Tu and Mahdyiar (2010), where a number of approaches are reviewed. What can certainly be concluded is that due to the tectonic setting and seismic activity around Chile, large magnitude earthquakes have occurred in the past and will undoubtedly occur in the future. Estimates of when these events might occur and how big they might be are exactly the challenges that the scientific community faces.
Conclusions
The Maule earthquake is, so far, the natural catastrophe producing the largest insured losses of 2010. The event occurred in a region of high seismicity and where large magnitude events have historically taken place. In this sense, it is expected that large magnitude events will occur again in Chile in the future. For this reason, Chilean authorities have developed a stringent seismic design code and implemented good construction practices that, with few exceptions, produced adequate structural performance of buildings during the 8.8 Mw earthquake.
Two potential seismic gaps further North from the Maule region, in the Arica and Tarapacá regions, close to the border with Perú, have been highlighted
References
- http://www.air-worldwide.com
- Alarcon, J.E., Taucer, F. and So, E. (2008). The 15 August 2007 Pisco, Peru, Earthquake – Post Event Field Survey. Proceedings of the 14th World Conference on Earthquake Engineering. Beijing. Paper 01-1067.
- AIR Worldwide (2009). The AIR Earthquake Model for Chile http://www.air-worldwide.com/Client- Support.aspx
- Franco, G. and Siembieda, W. (2010). “Chile’s 2010 M8.8 Earthquake and Tsunami: Initial Observations on Resilience.” Journal of Disaster Research, 5 (5), pp. 577-590.
- NGDC - National Geophysical Data Center (2010). NOAA/WDC Historical Tsunami Data Base, http://www.ngdc.noaa.gov/hazard/
- Ruegg, J.C., A. Rudloff, C. Vigny, R. Madariaga, J.B. de Chabalier, J.Campos, E. Kausel, S. Barrientos and D. Dimitrov (2009). Interseismic strain accumulation measured by GPS in the seismic gap between Constitución and Concepción in Chile. Physics of the Earth and Planetary Interiors, 175, 78-85.
- Shen-Tu, B. and M. Mahdyiar (2010). Earthquake Risk in Chile after February 2010. AIR Currents, August 2010, http://www.air-worldwide.com/
- USGS – United States Geological Survey (2010). http://earthquake.usgs.gov/earthquakes/
1USGS -United States Geological Survey
2NGDC: USA National Geophysical Data Center.


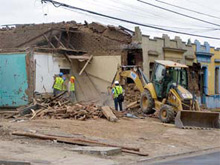 Figure 6. Collapse
and demolition of
adobe brick
structures in Talca
Figure 6. Collapse
and demolition of
adobe brick
structures in Talca(Source: AIR)
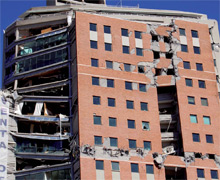 Figure 7. The Torre
O’Higgins in
Concepción
Figure 7. The Torre
O’Higgins in
Concepción
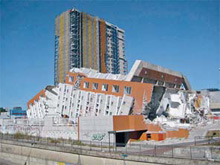 Figure 8. Fully
collapsed building
located in
Concepción
Figure 8. Fully
collapsed building
located in
Concepción(Source: AIR)
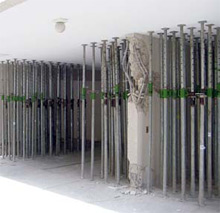 Figure 9. Partial
collapse of shear
walls
Figure 9. Partial
collapse of shear
walls(Source: AIR)
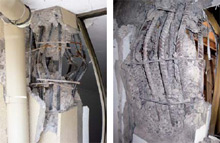 Figure 10. Large
buckling of
the vertical
reinforcement bars
exacerbated by the
lack of enough
lateral, or
confinement
reinforcement
(Source: AIR)
Figure 10. Large
buckling of
the vertical
reinforcement bars
exacerbated by the
lack of enough
lateral, or
confinement
reinforcement
(Source: AIR)